2016 CANDY HIERARCHY: SUPPLEMENTAL RAW DATA AND NEW ANALYSES
PREAMBLE:
This is for you data nerds who might want to dig into the data a little deeper (we didn’t have a lot of time to play around with it). We’ve provided access to the full excel spreadsheet (which also includes data that was cut off from our analysis due to us having to get started earlier for today’s piece on BoingBoing).
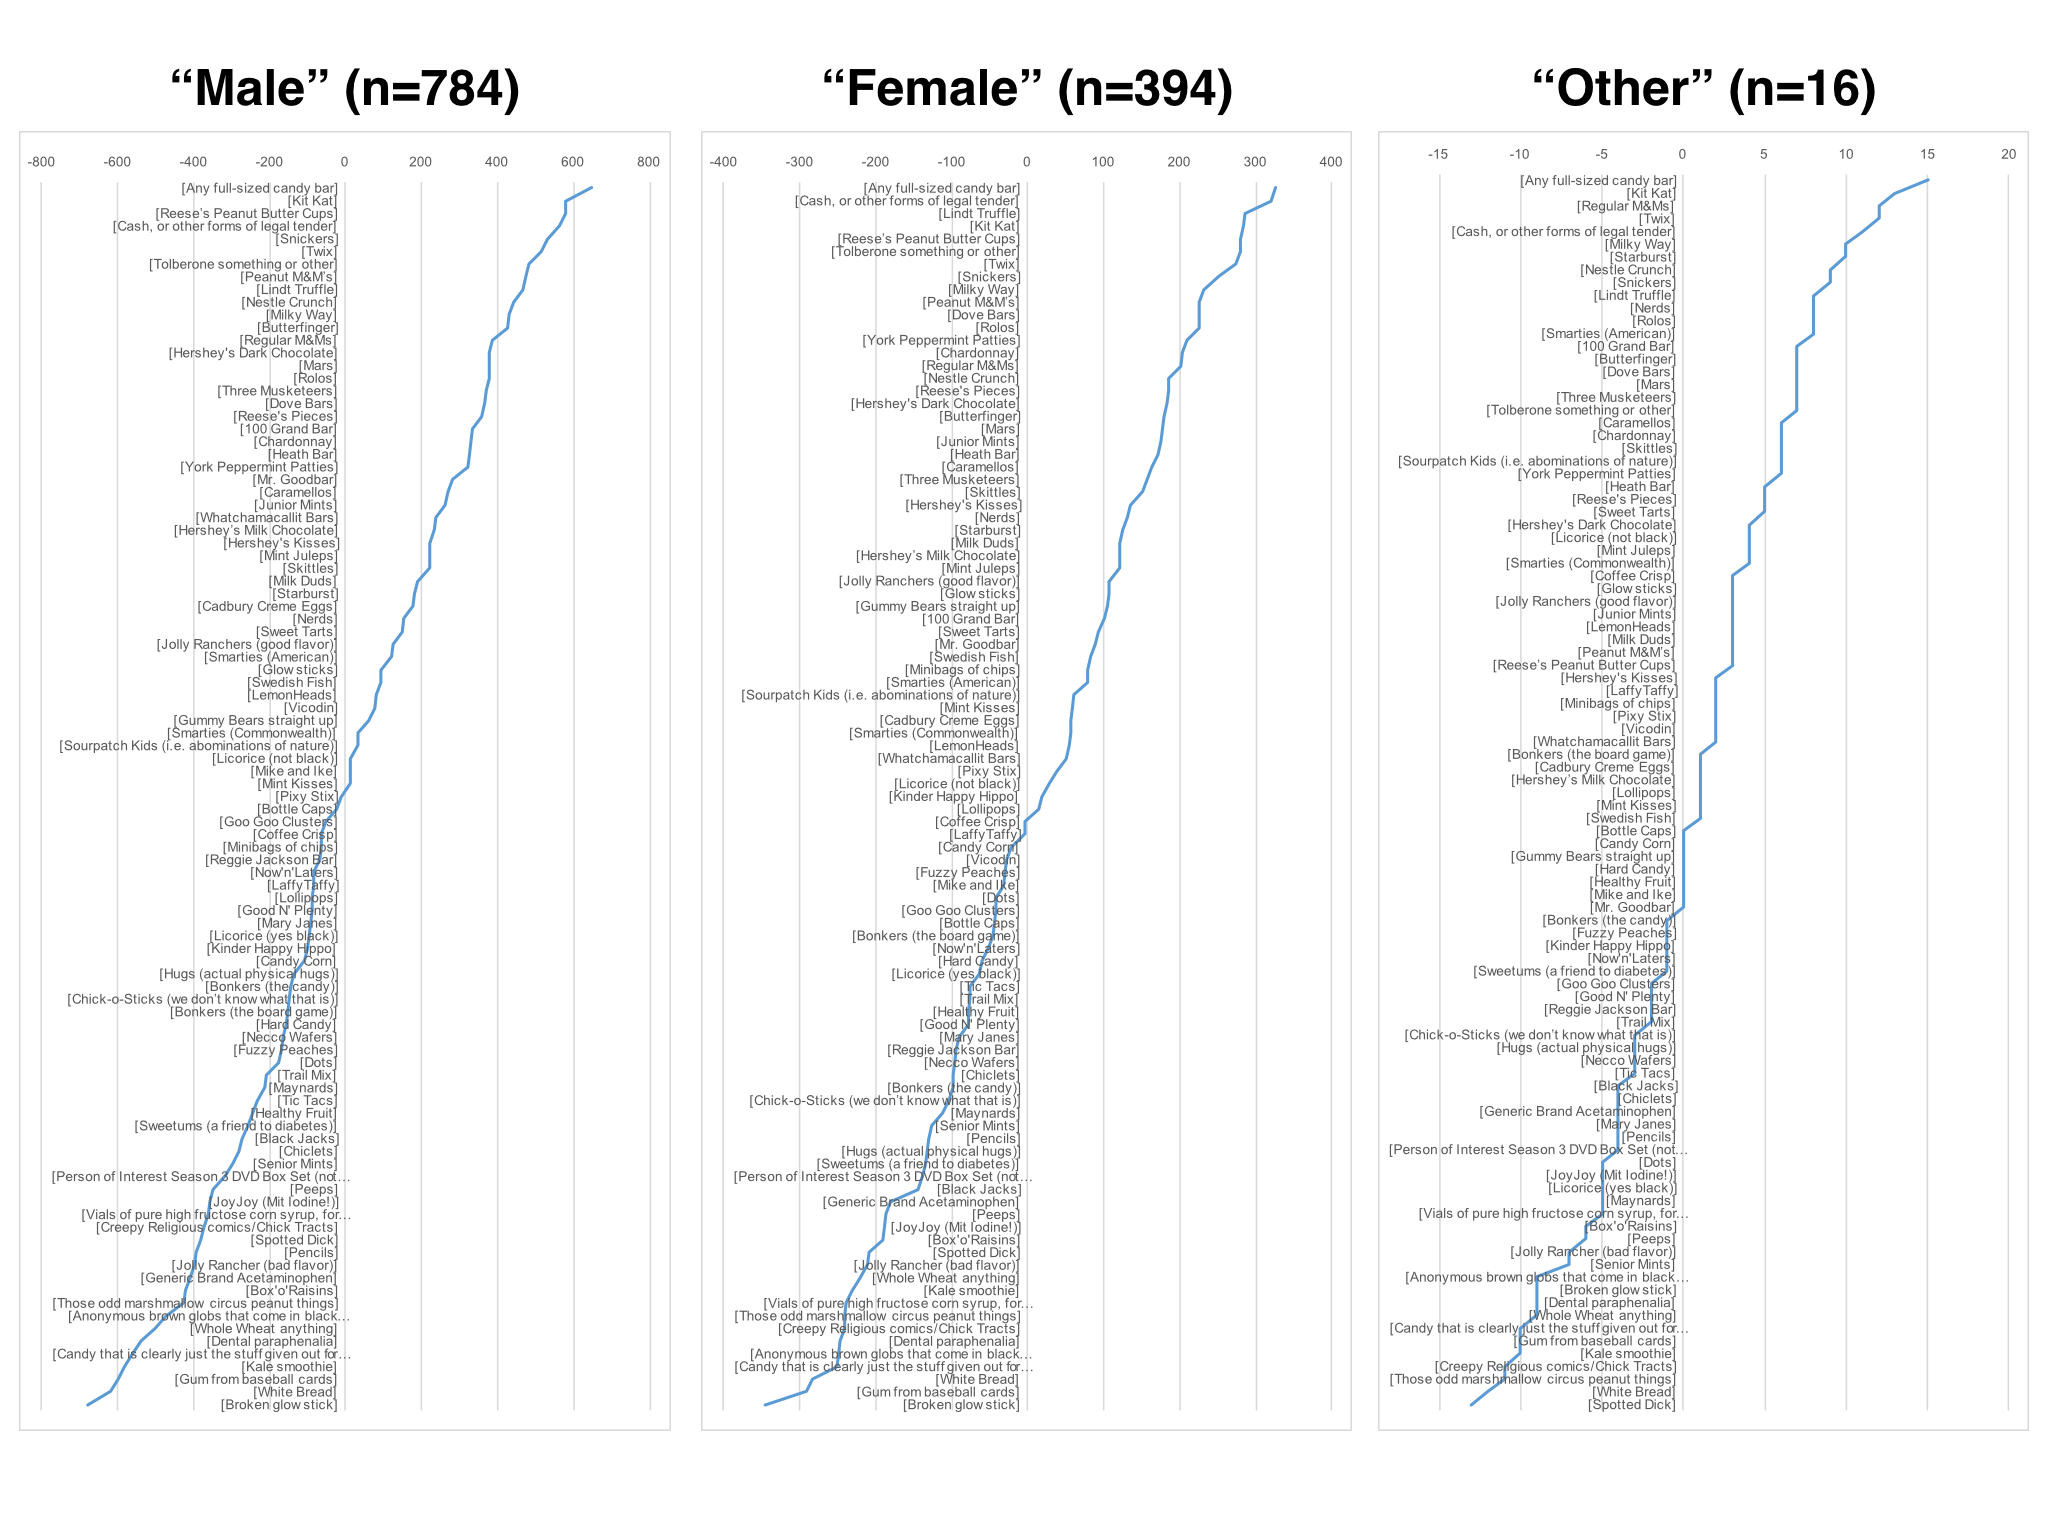
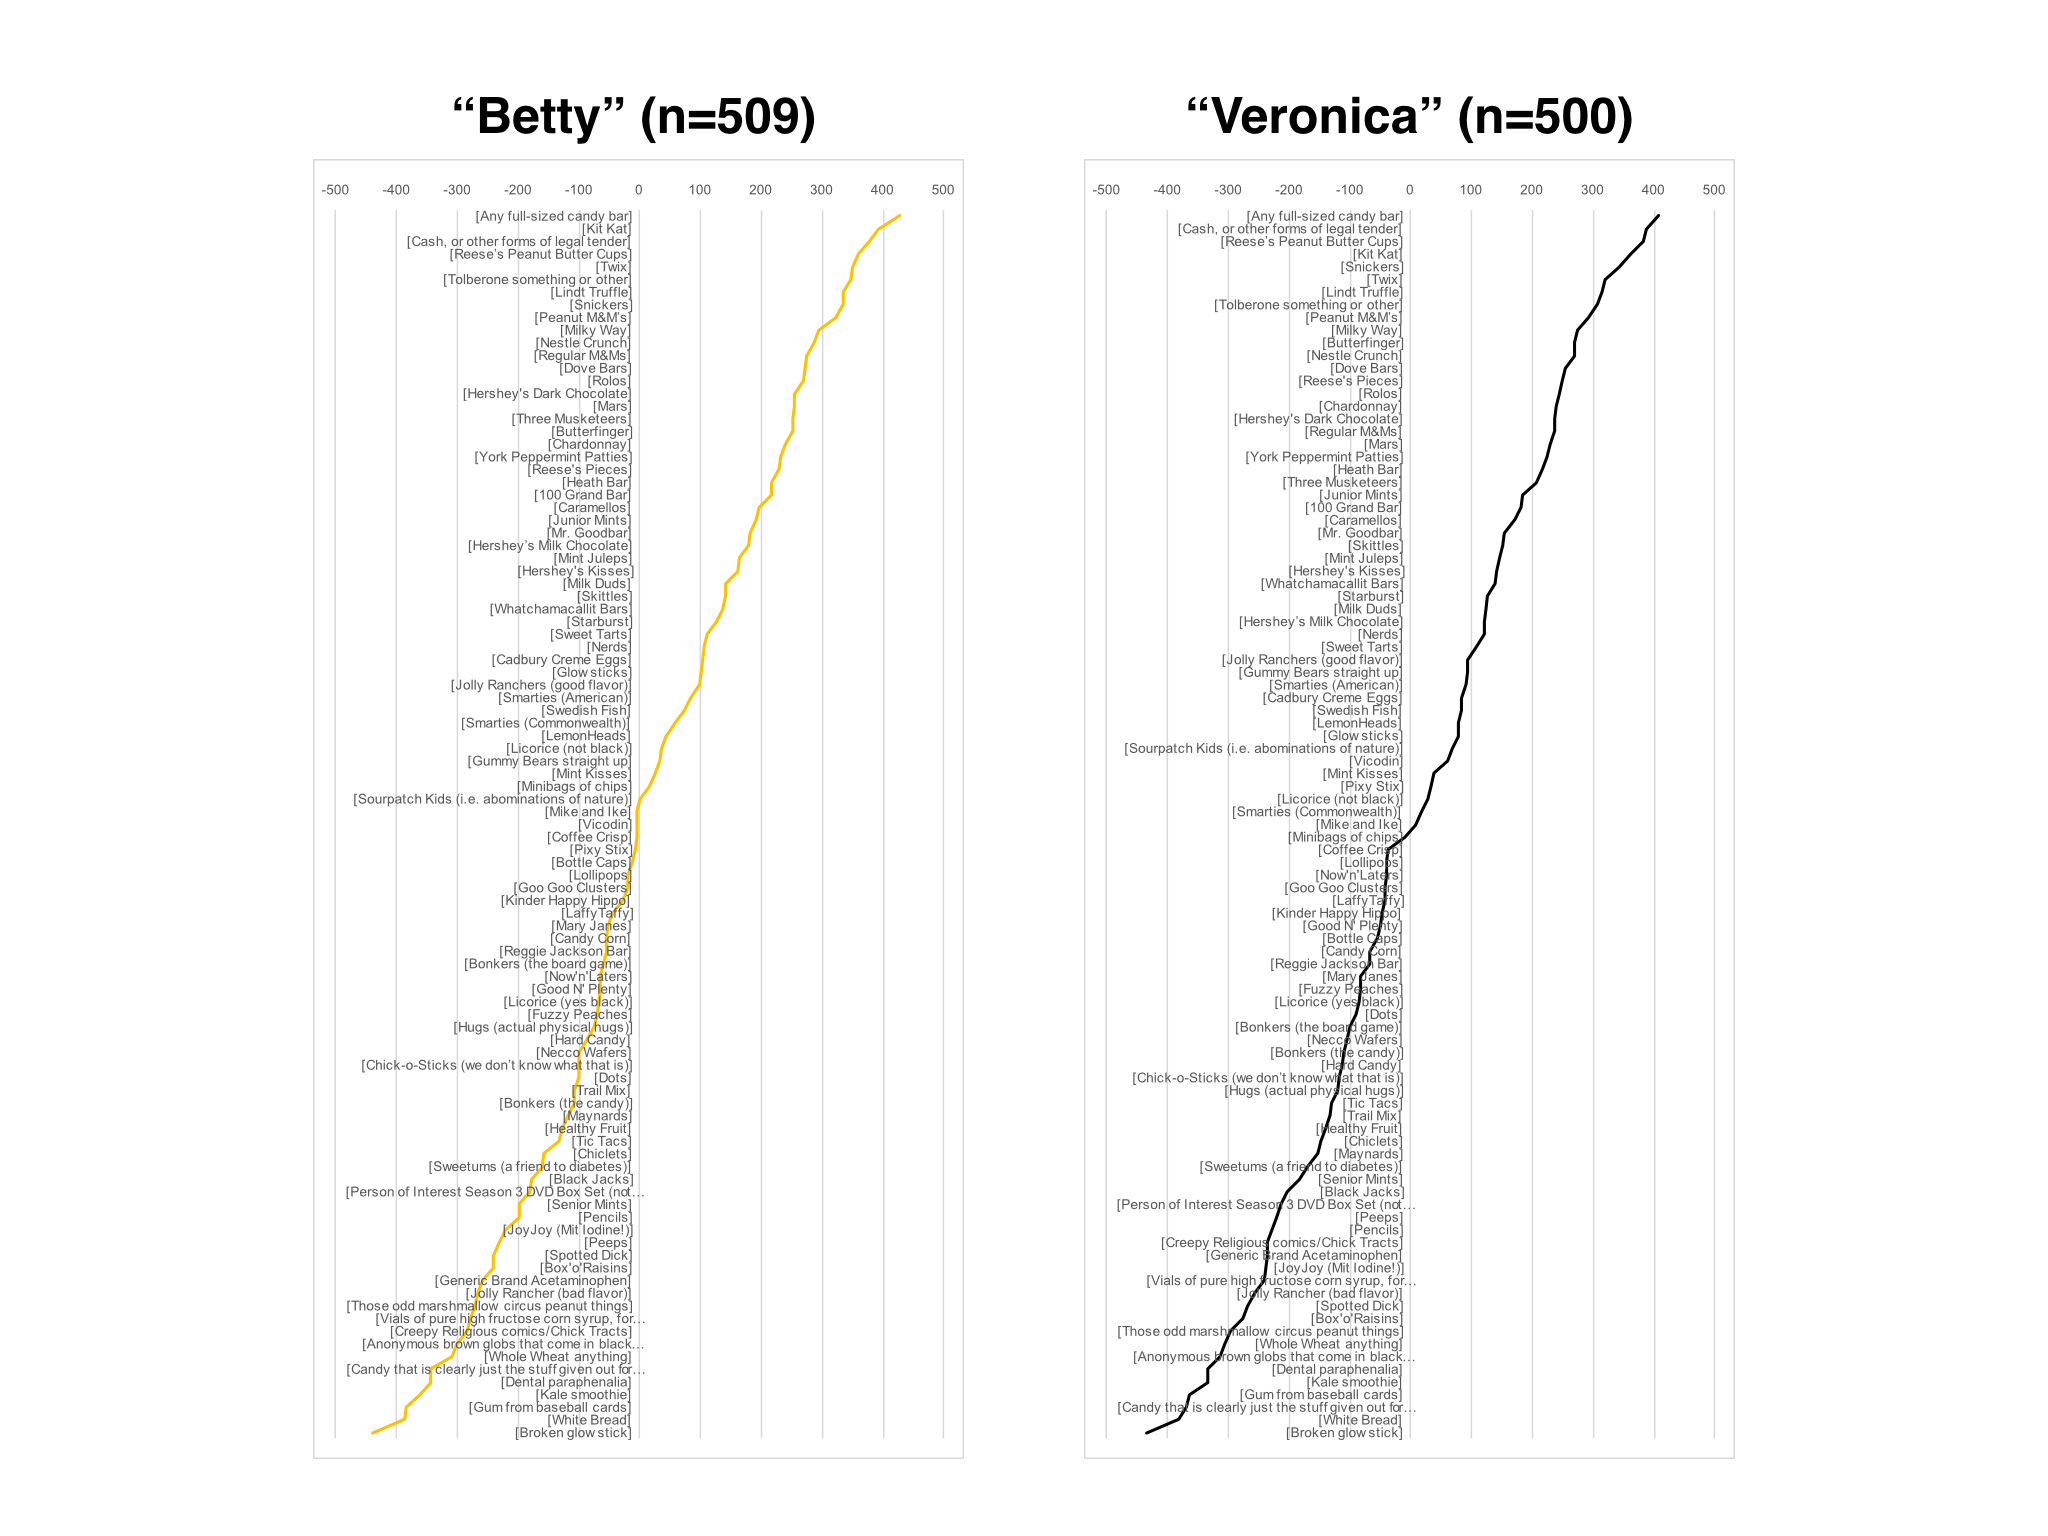
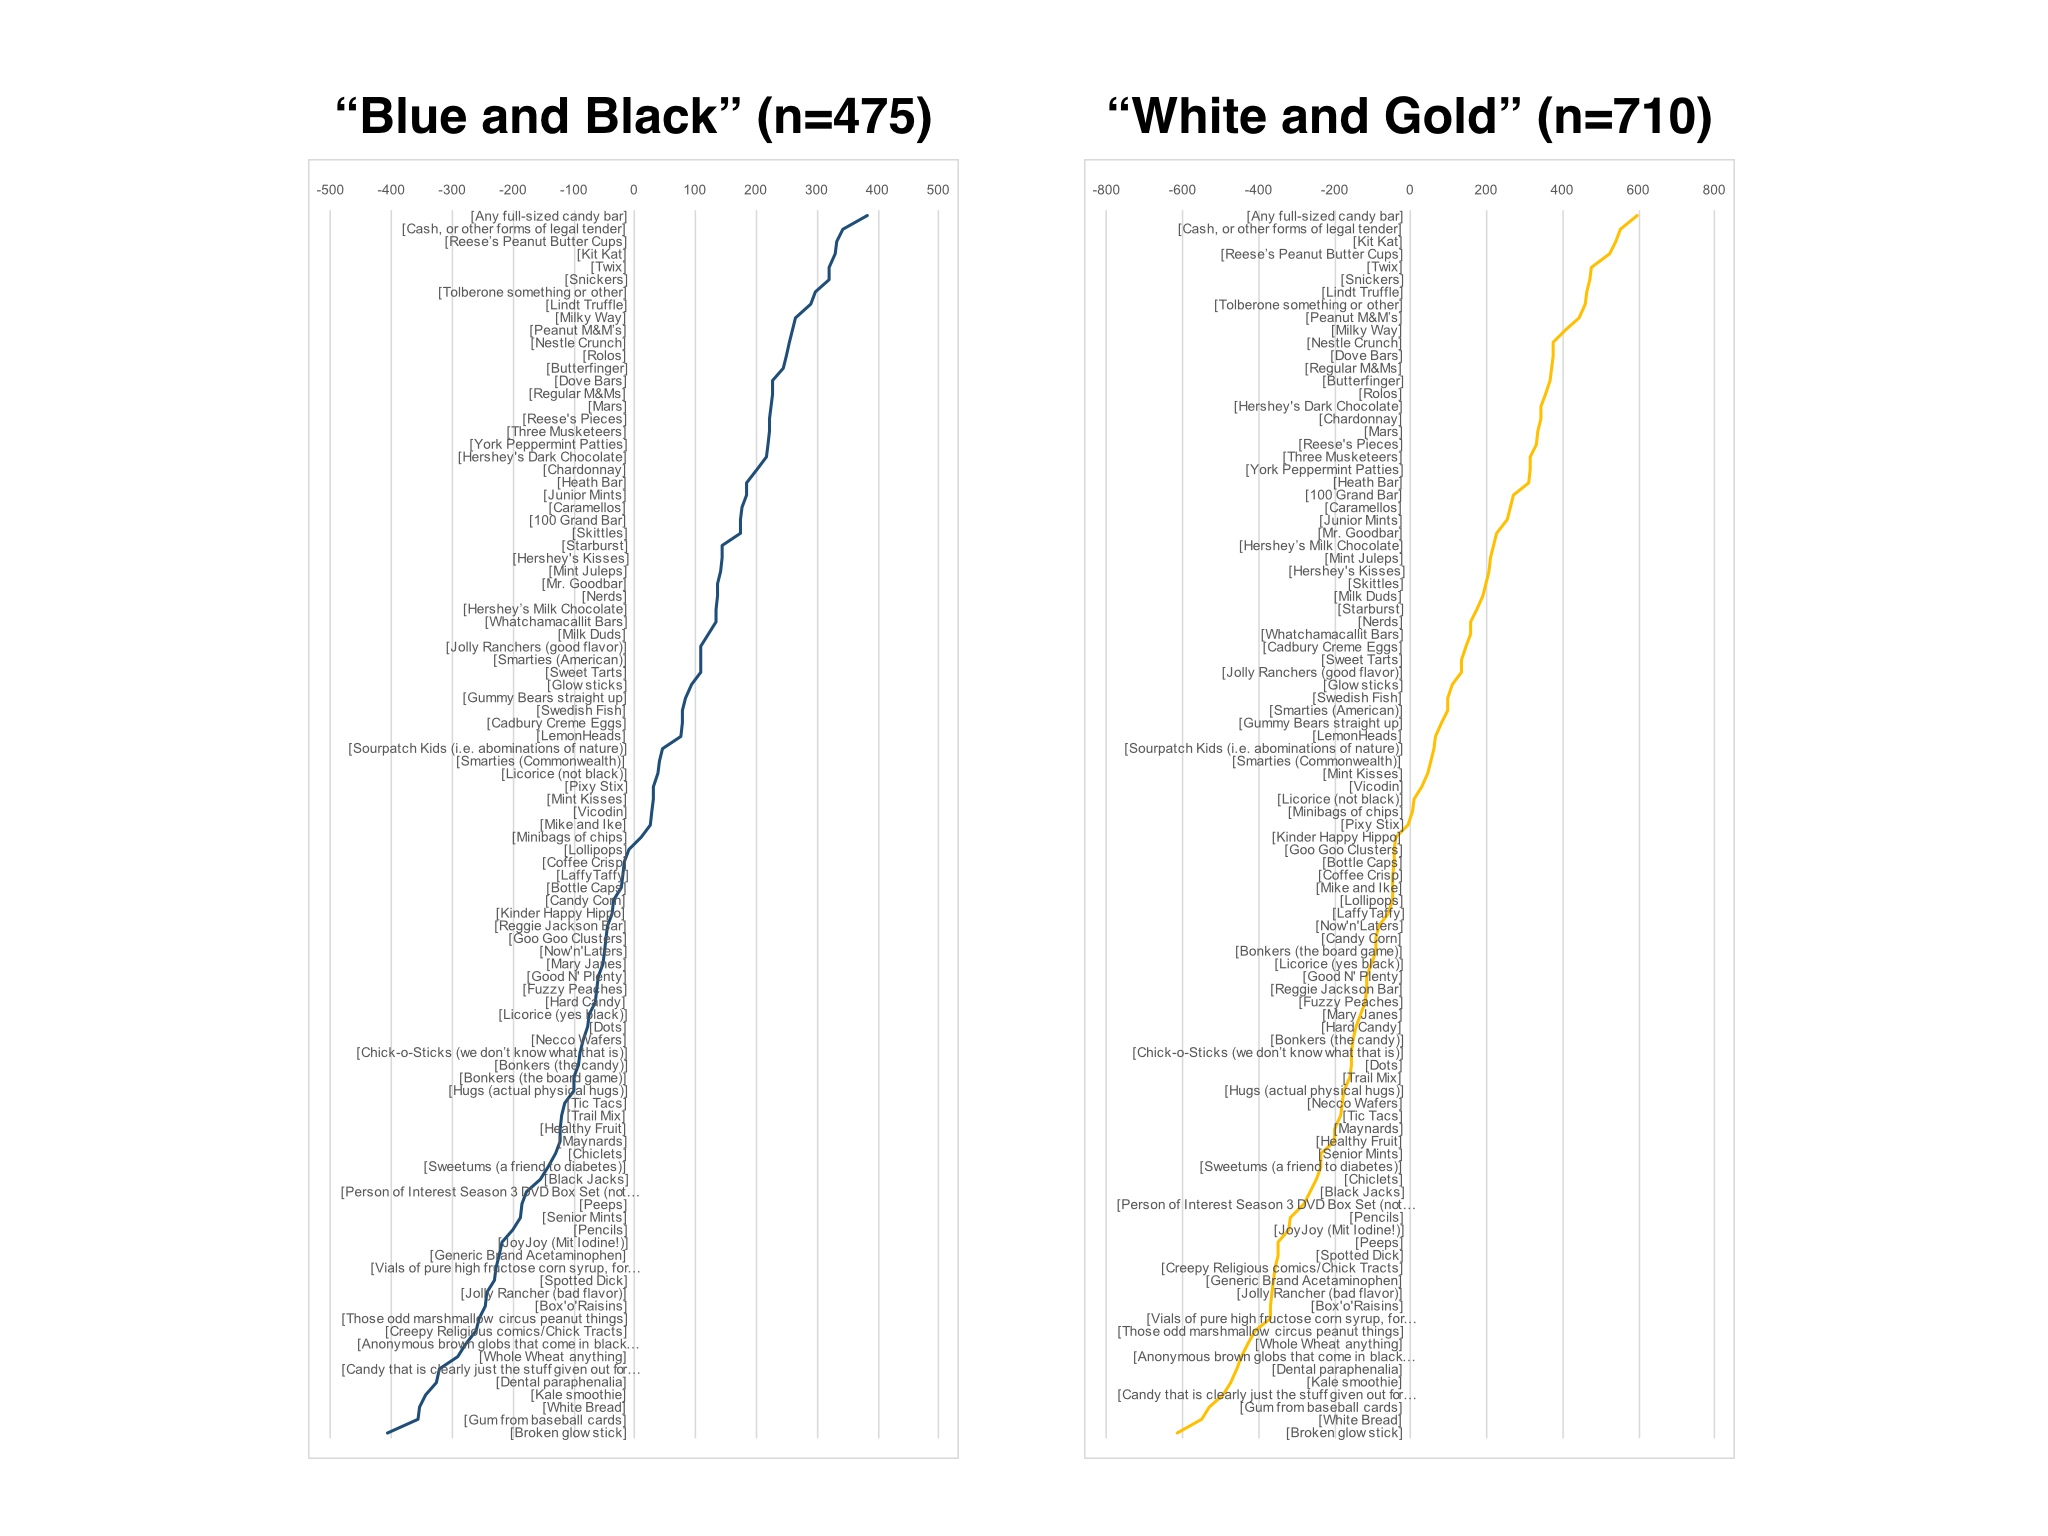
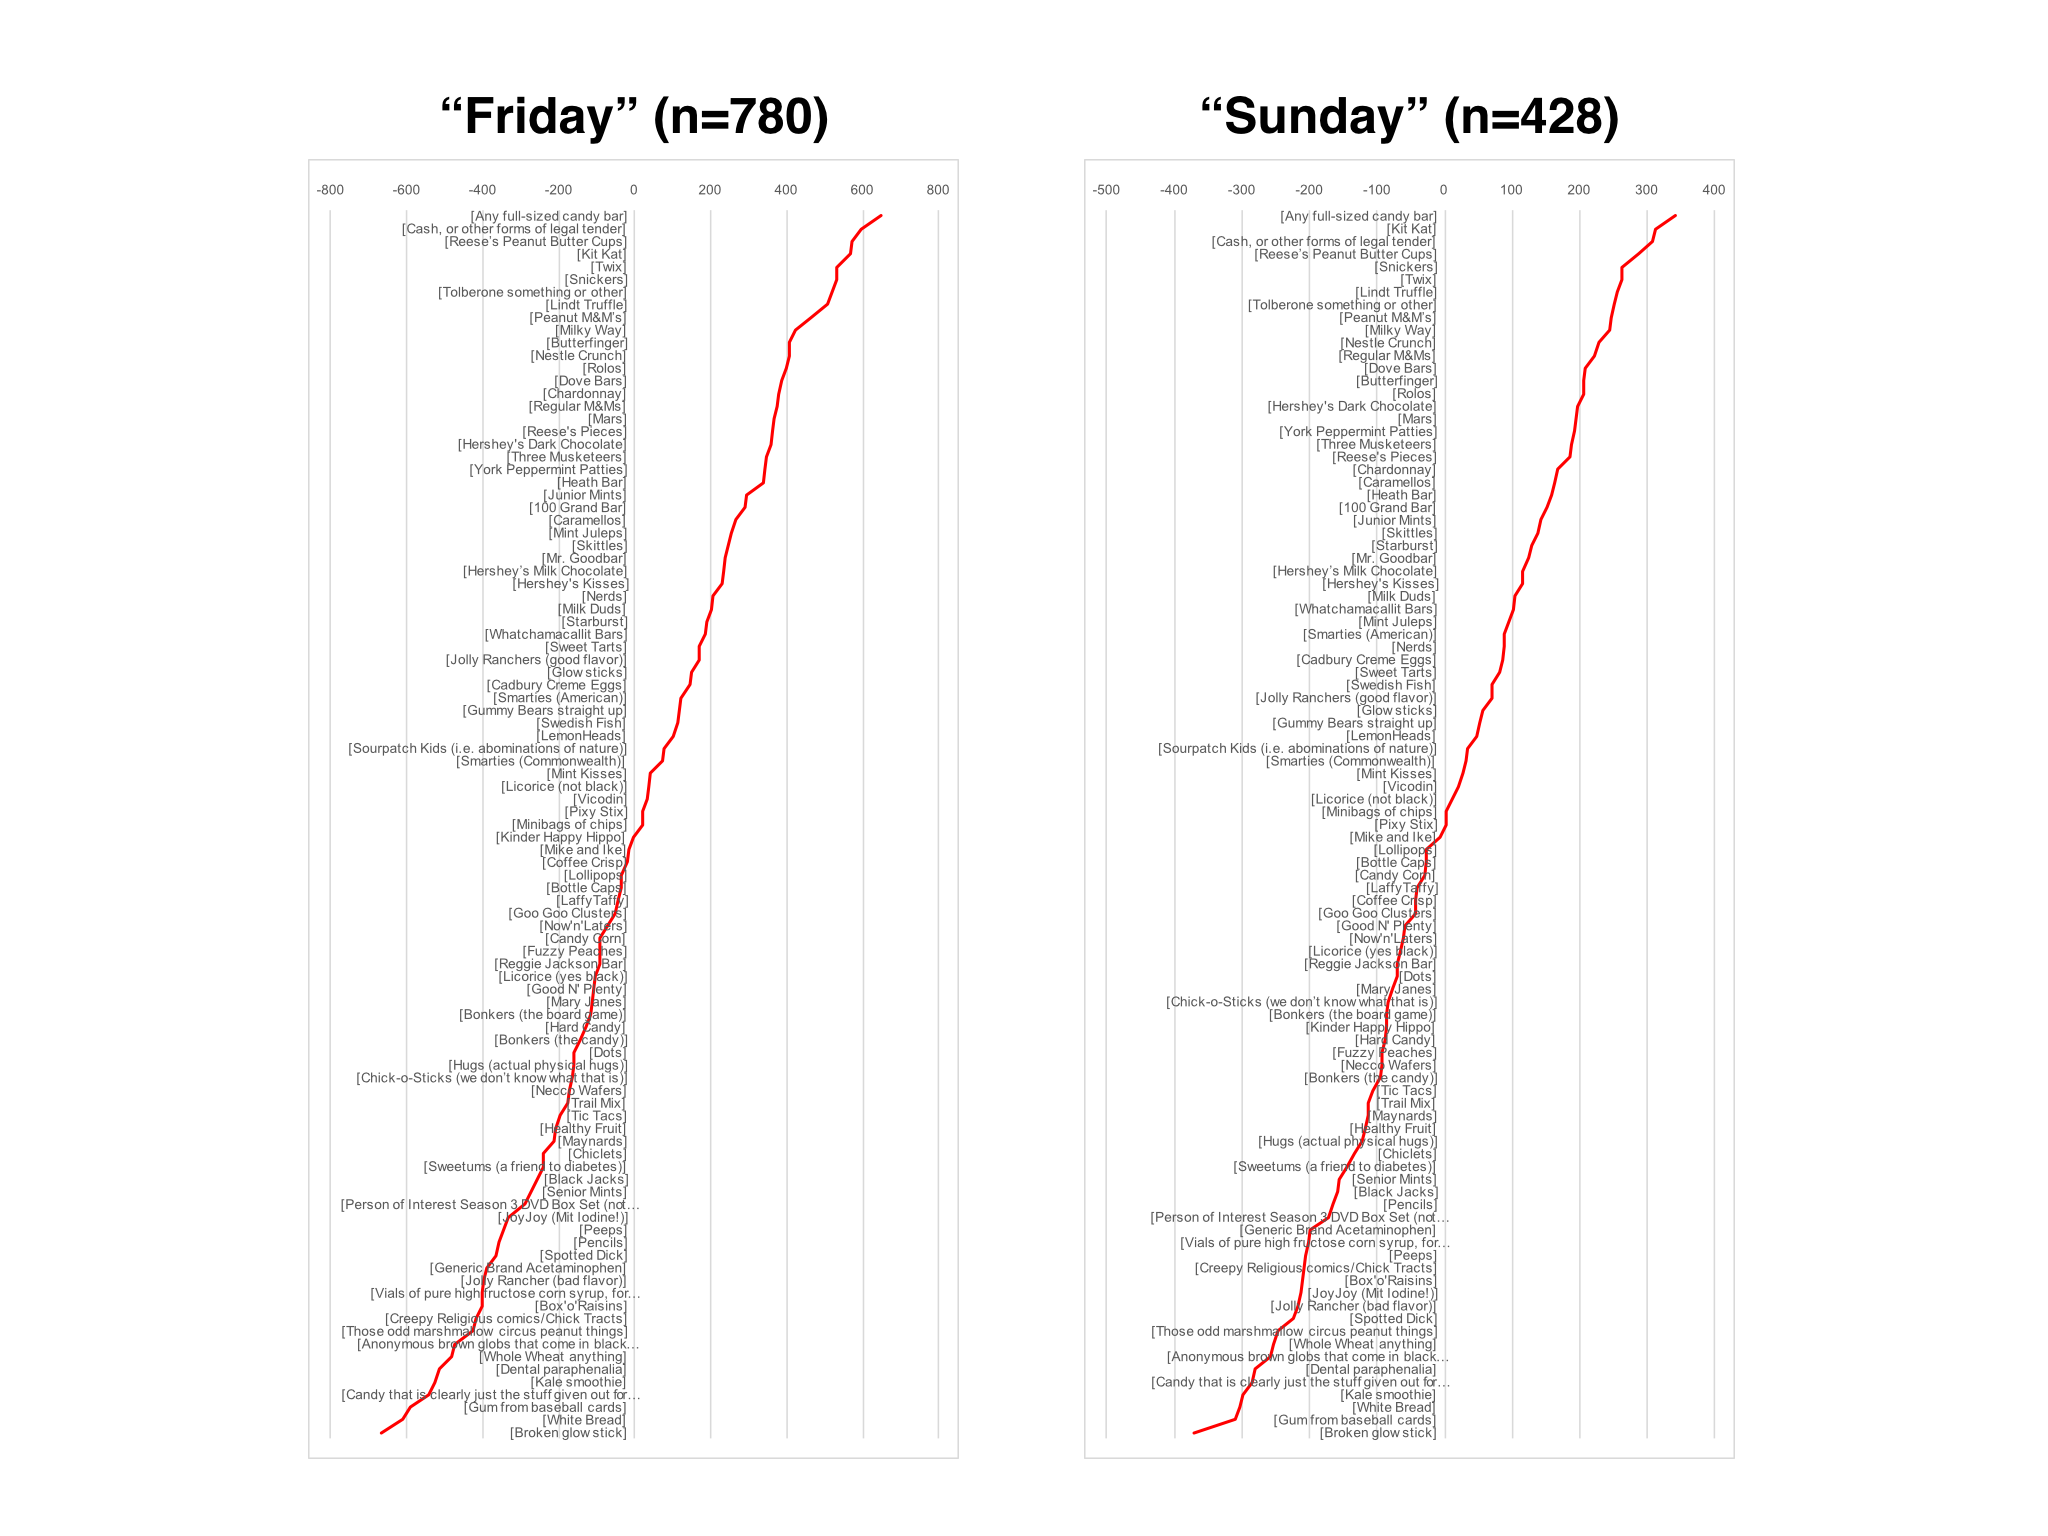
We’re essentially hoping that with more rigorous analysis of the data, we might be able to find out whether there are statistically relevant differences in how different folks rate their candies For example, do people who see the dress in a certain way, more likely to have joy over certain candies, when compared to the other dress colour choice? Does knowing J.J. Abrams personally result in a certain portfoilio of candy choices? The types of analytical queries are kind of endless, and they don’t even have to relate specifically to candy.
Anyway, if any of you folks are game on, do let me know what you do with the data via twitter or email (db@mail.ubc.ca), and I’ll do my best to be post these other analyses up here at the SCQ – sort of creating a analytical hub if you will. Hopefully, we’ll be able to make this thing more and more robust each year.
RAW DATA FILE:
(LINK TO – xlsx) As of October 30th, 6:00pm PST.
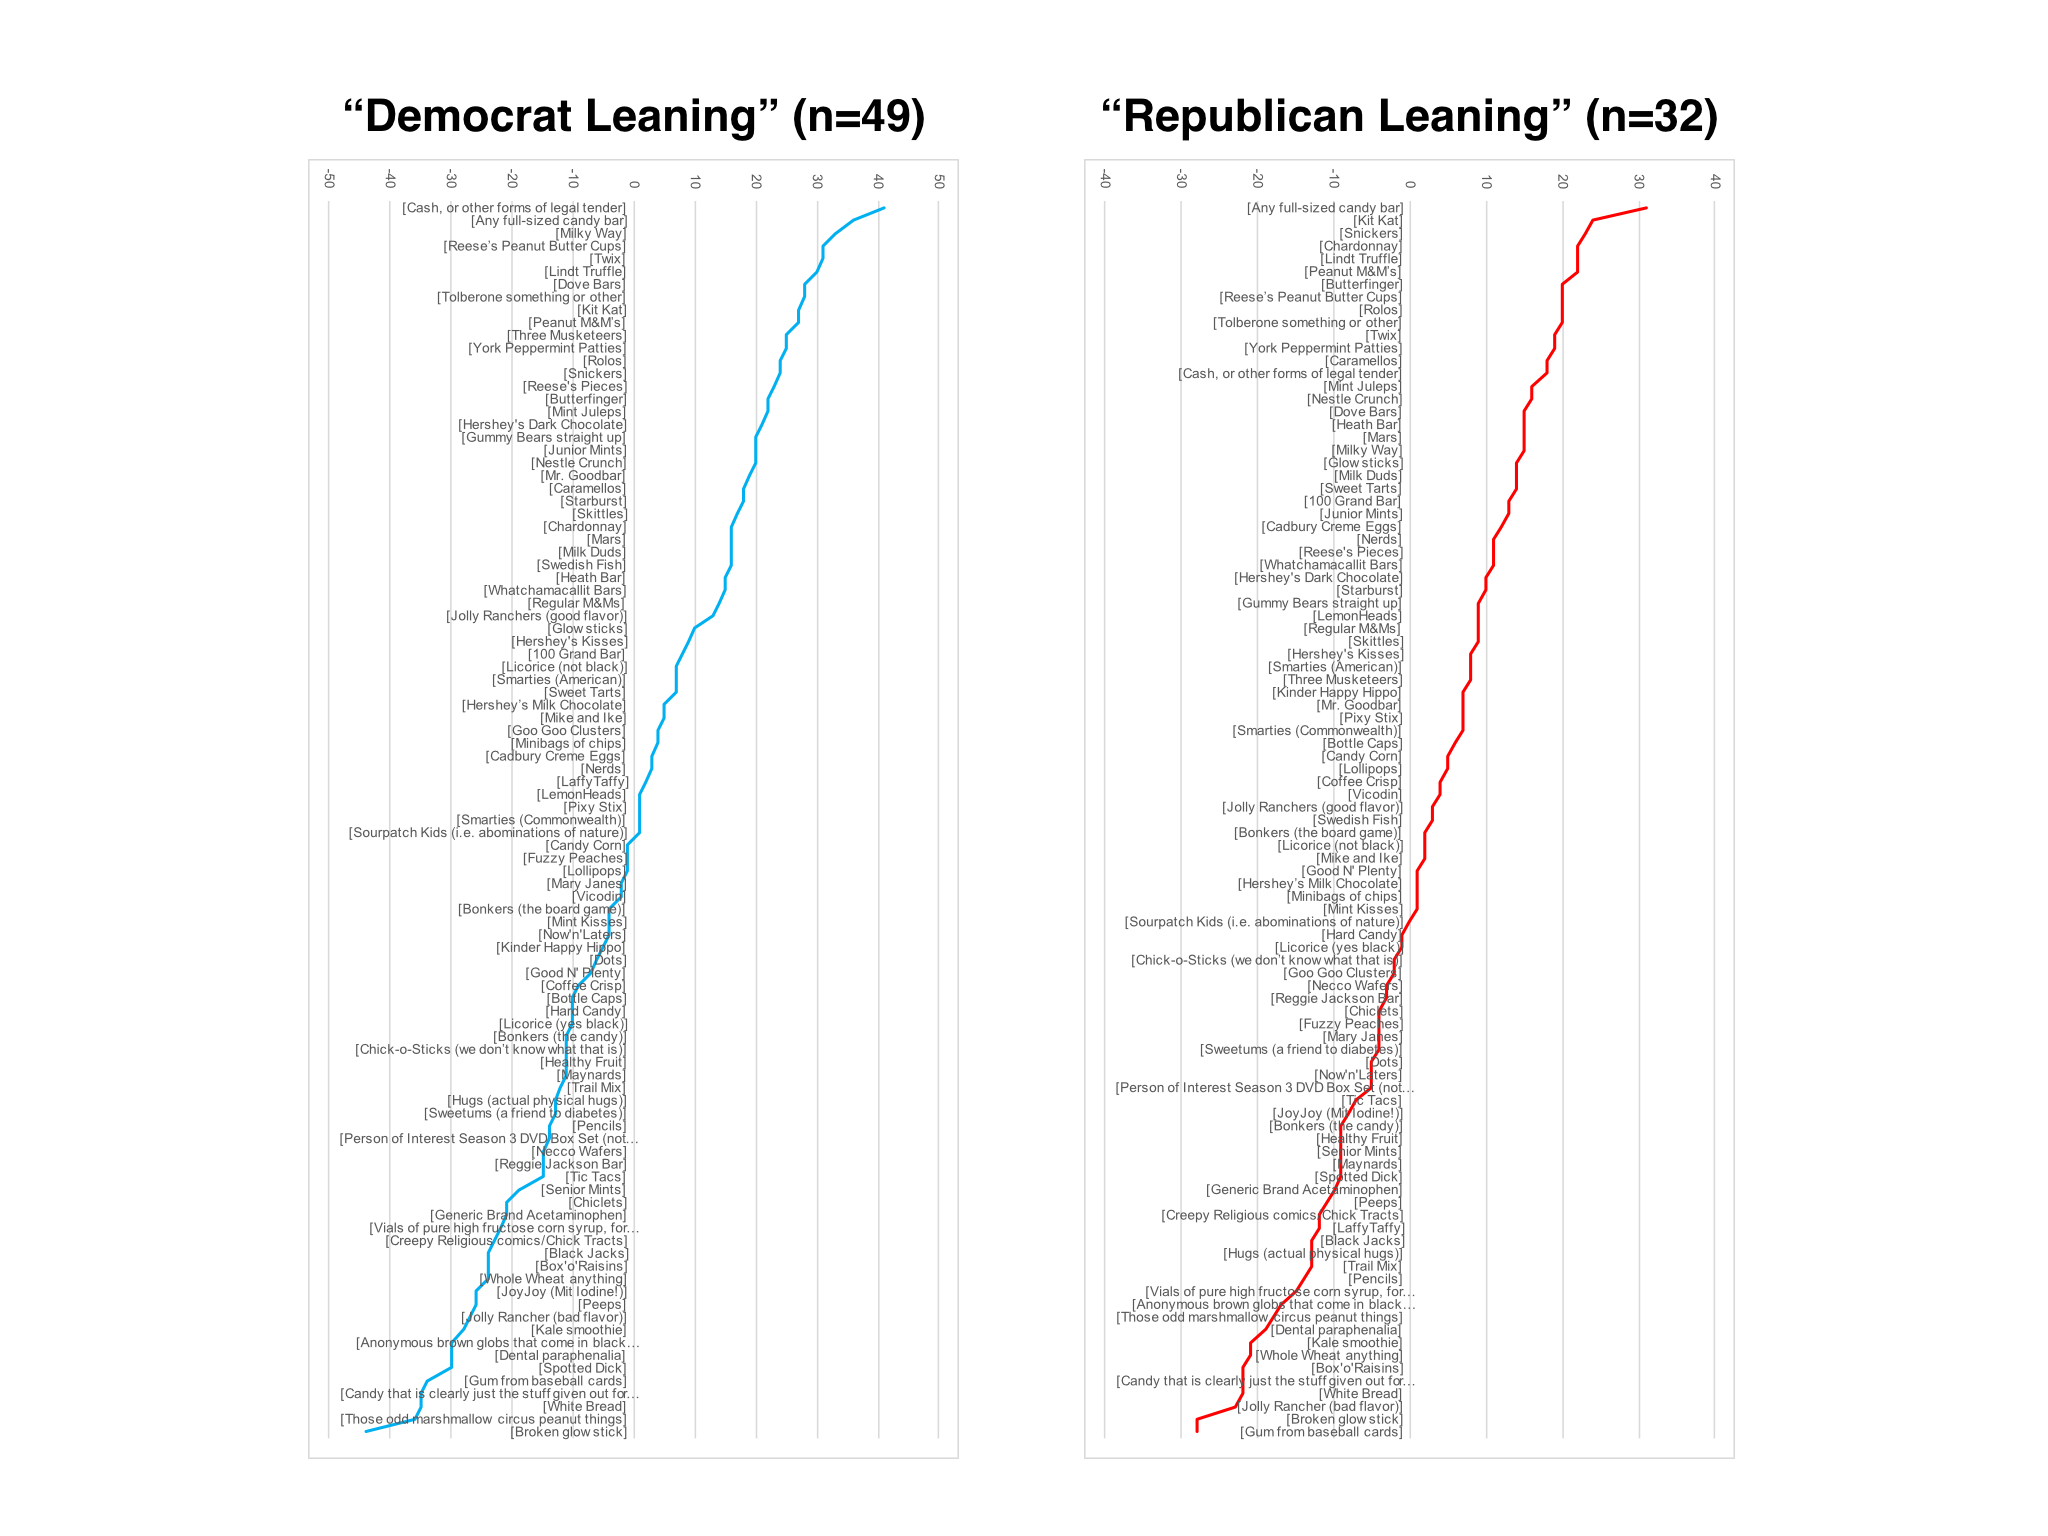
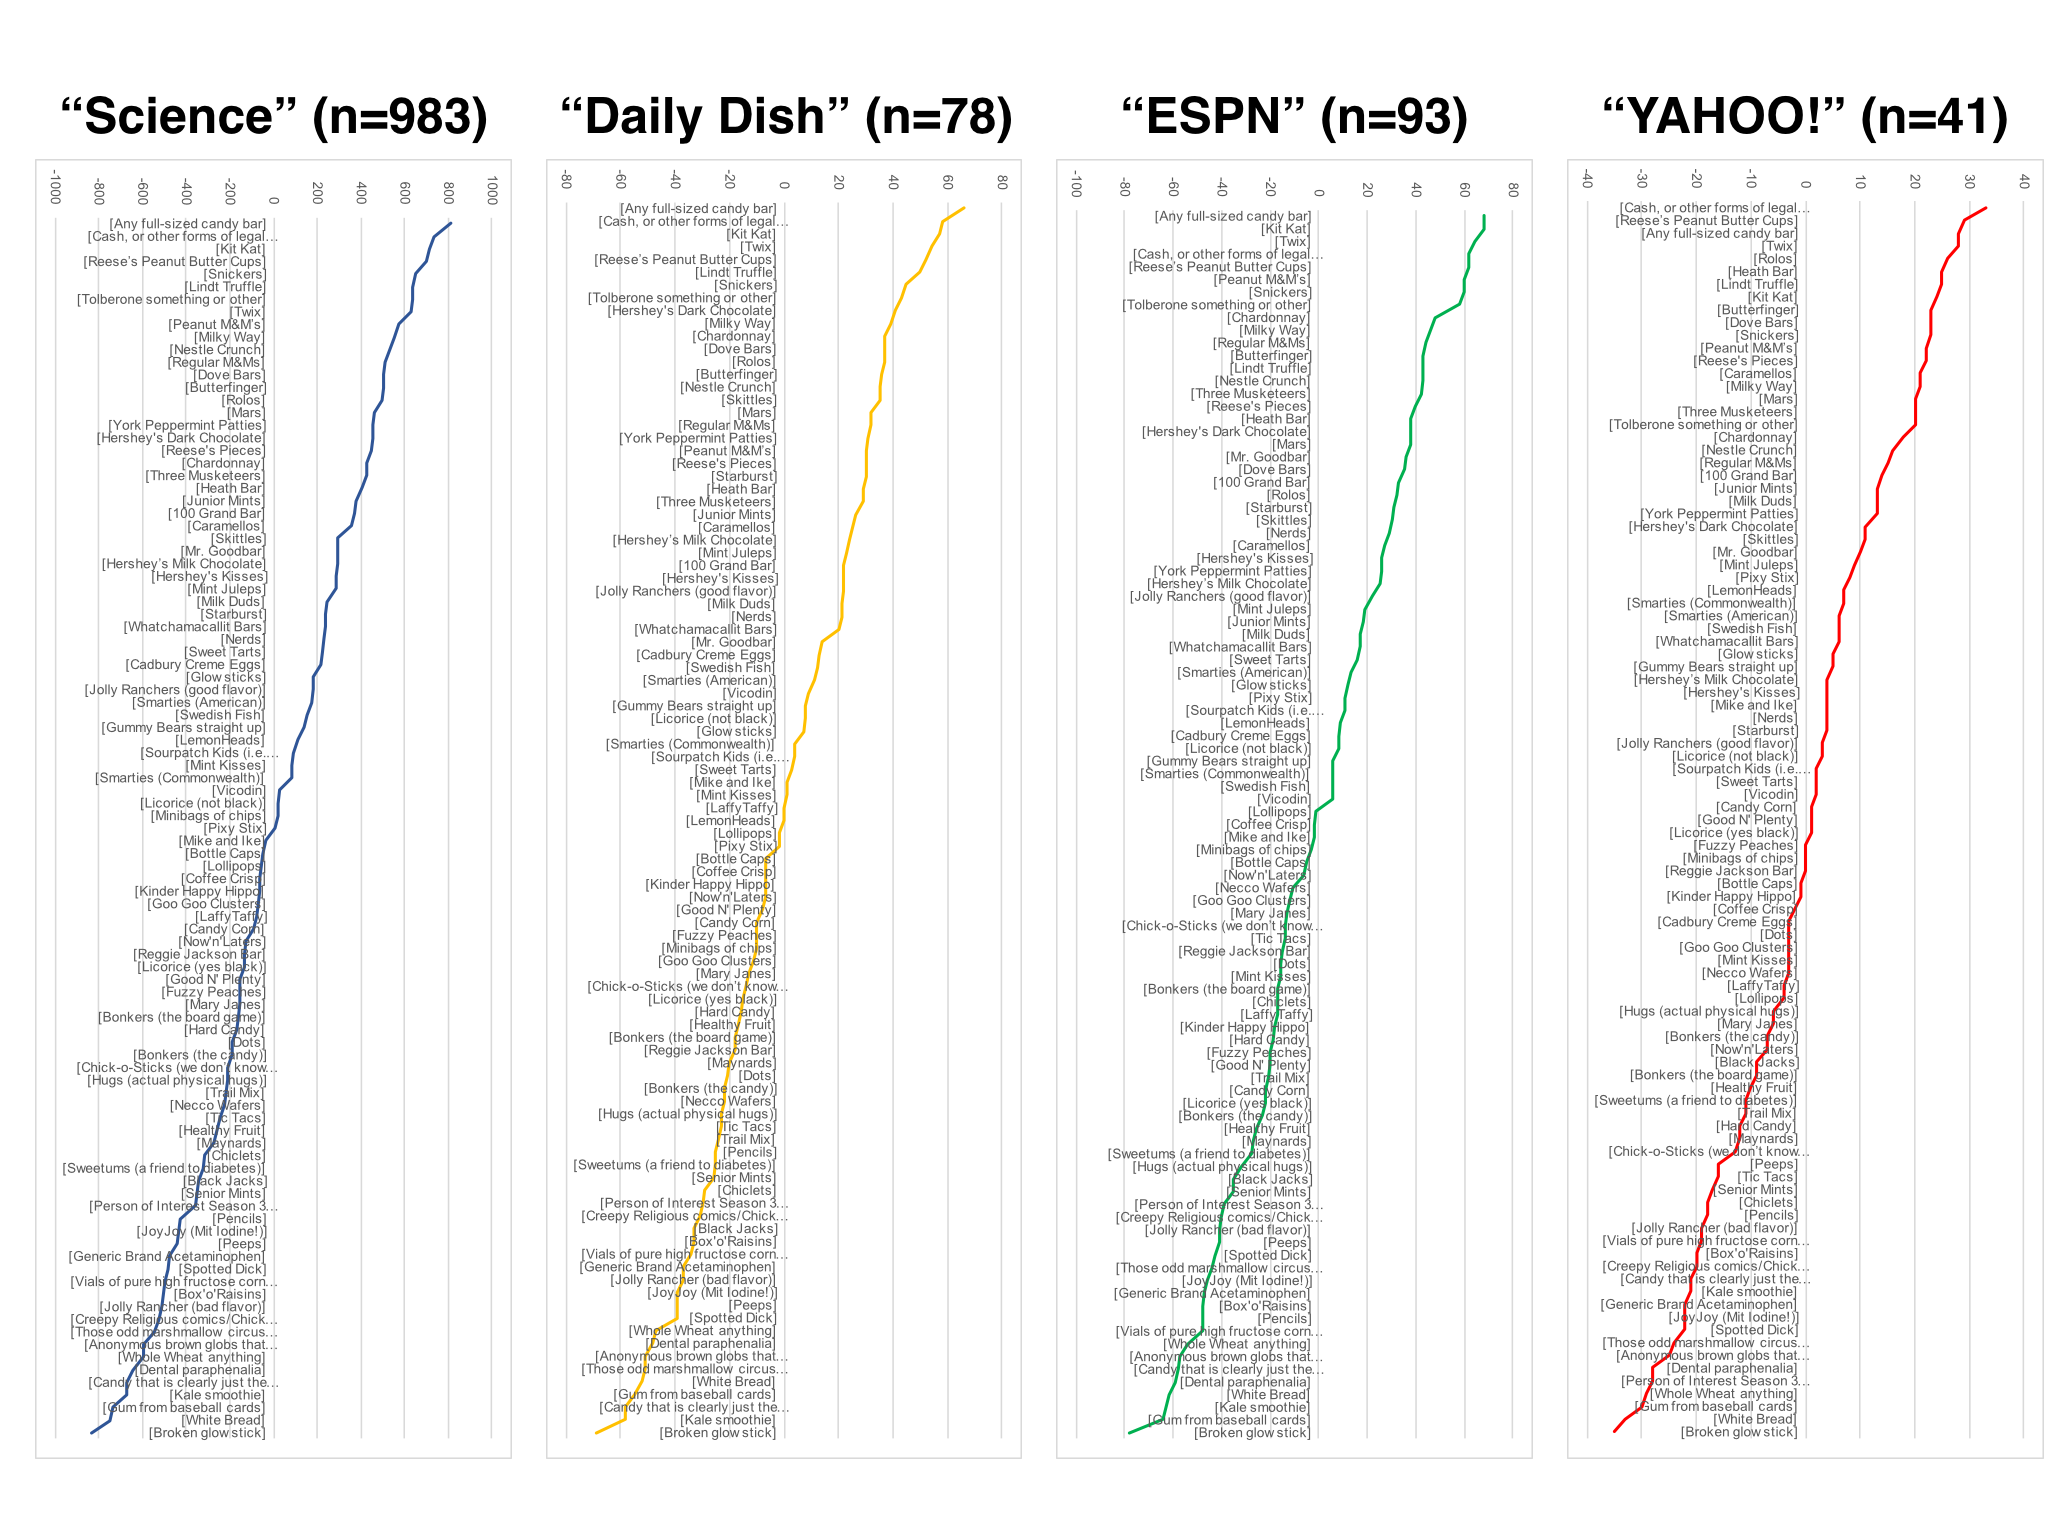
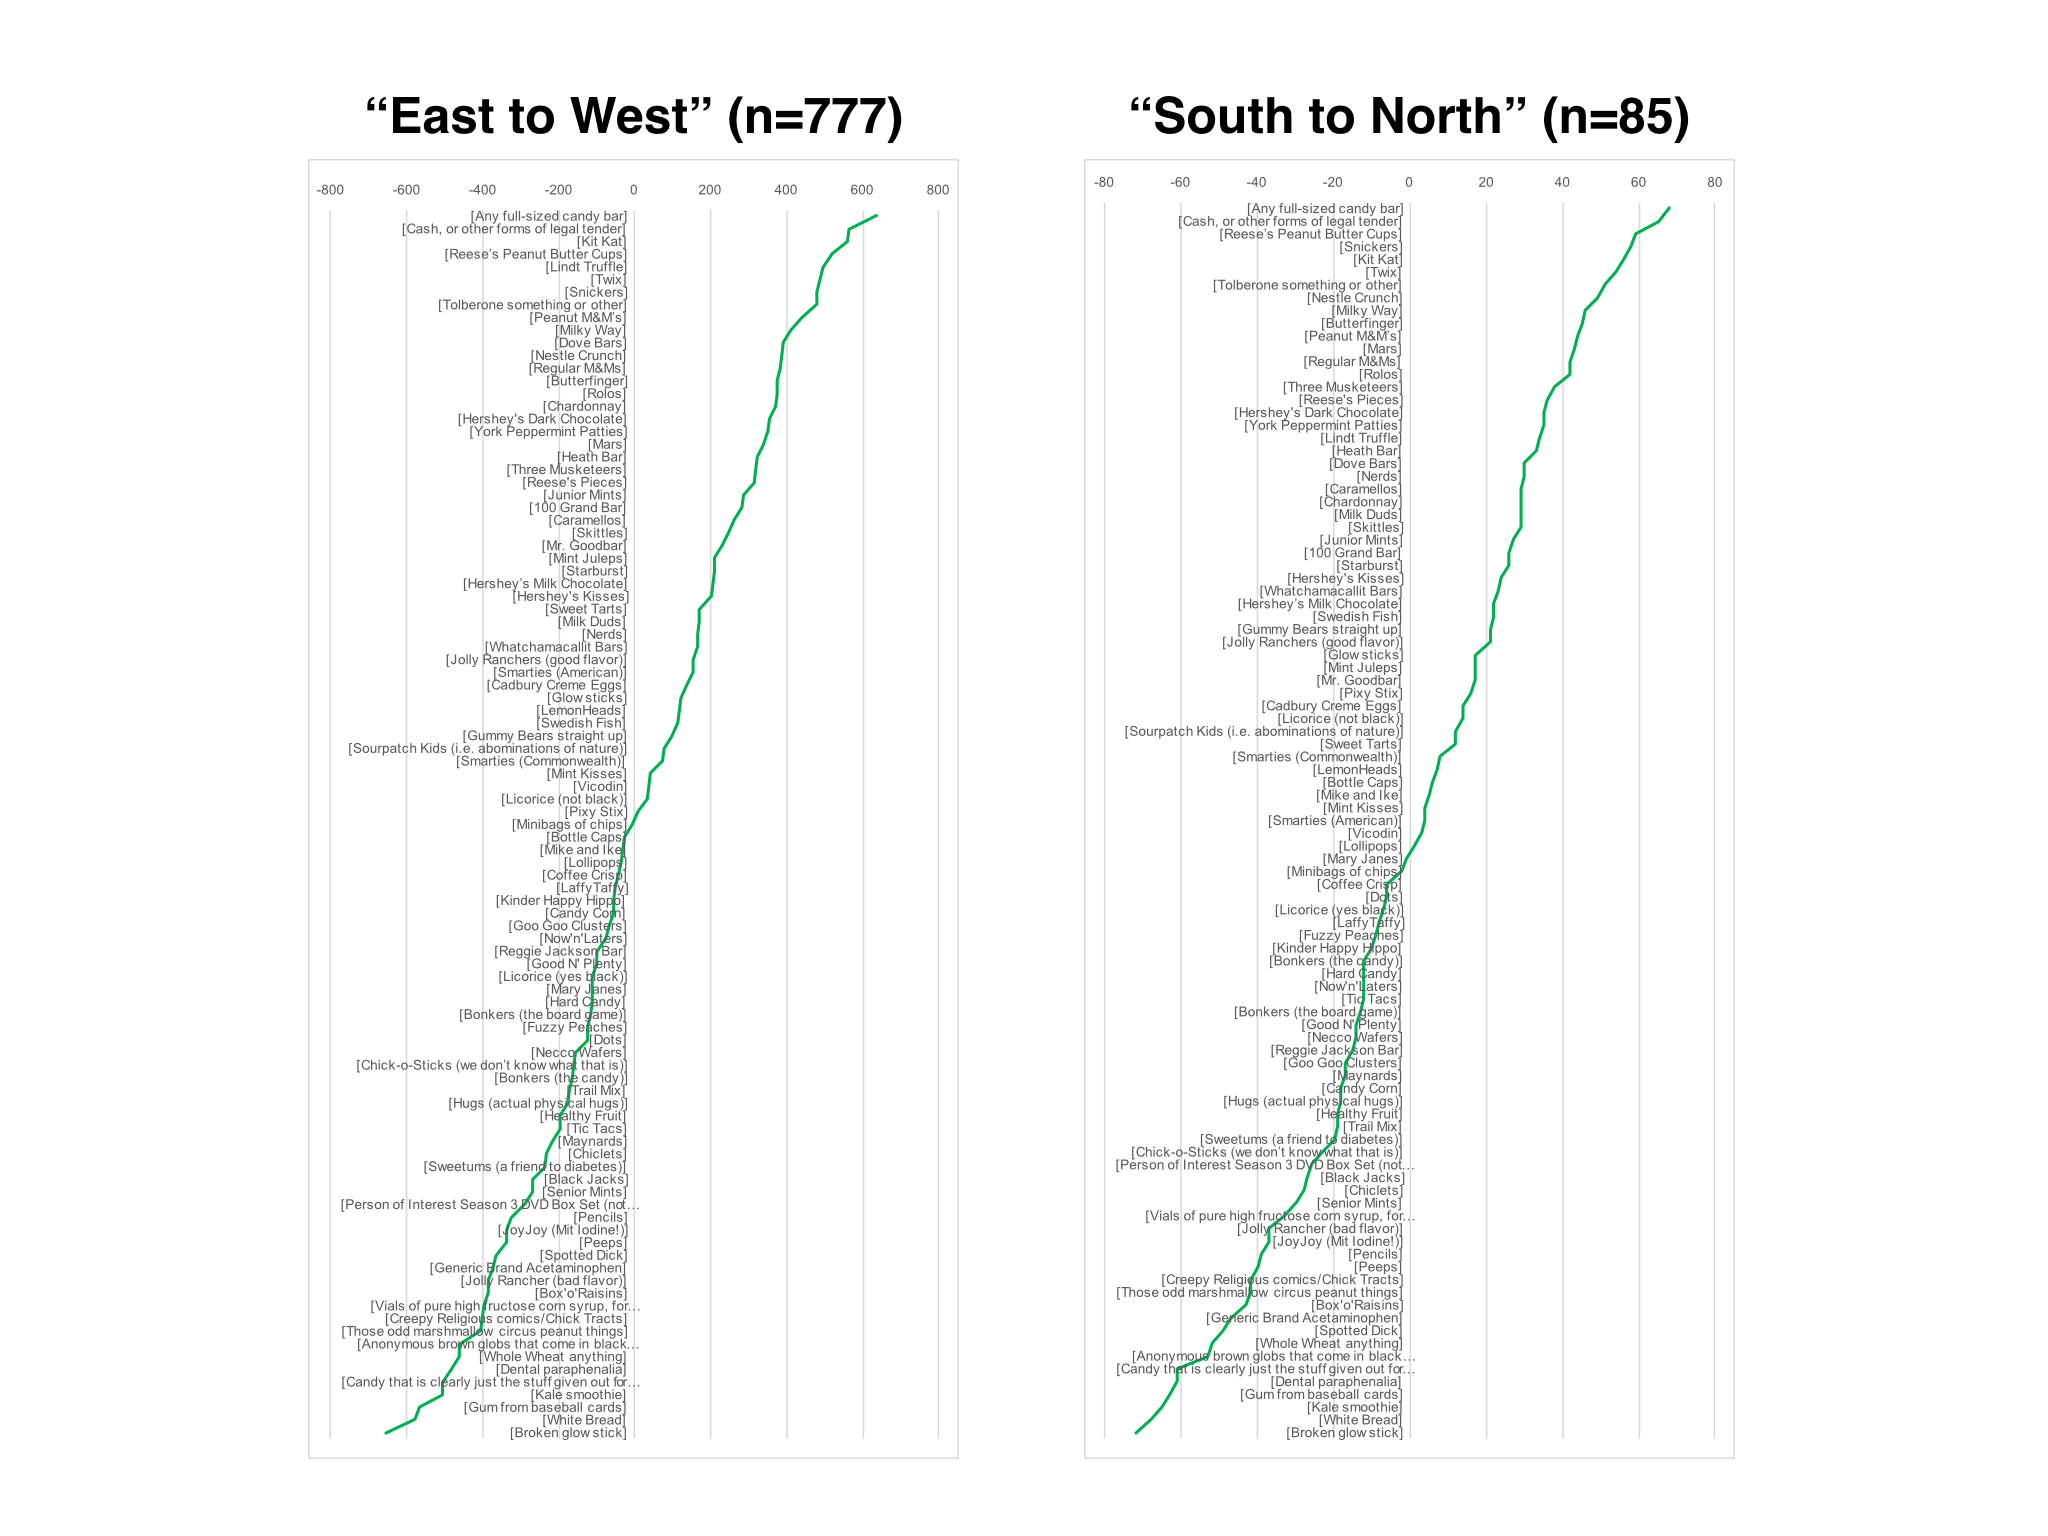
SOME DEMOGRAPHIC GRAPHS FOR YOUR VIEWING PLEASURE:
(Please click on image to enlarge)
SOURCES:
Cohen B.R. and Ng. D. Tell us about your Halloween candy preferences, and other things besides. Boingboing, October 24th, 2016 – link
Cohen B.R. and Ng. D. The Candy Hierarchy 2016 Boingboing, October 31st, 2016 – link
ABSTRACT:
Candy candy candy. Co-principle investigators (PIs) Cohen [https://twitter.com/somelaterdate] and Ng [https://twitter.com/ng_dave] again report on new findings. From 2006 to 2013 [http://boingboing.net/2013/10/30/the-candy-hierarchy-2013.html], the PIs conducted a longitudinal study guided by PI expertise and cloaked pseudo-corporate sponsorship. Yet, lo, and thine PIs were so moved by the yearly outpouring of commentary that they opened up the study to additional data sources, namely people. The 2014 Candy Hierarchy [http://boingboing.net/2014/10/31/the-candy-hierarchy-2014.html] resulted from survey data in the thousands; the 2015 Candy Hierarchy [http://boingboing.net/2015/10/31/the-candy-hierarchy-2015-your.html] was based on 518,605 data points obtained from 5459 individuals. It also opened up a new flank in the survey beyond candy that the PIs continued this year. The secondary study sought to understand the character of the survey takers. It was also used to force an agenda that an area podcast [https://twitter.com/somelaterdate] won’t shut up about, like preferred days of the week and proper apple eating and now here we are with about 1275 respondents and 120,000 results and a real swell hierarchy. Just real swell.
CITATIONS:
(will list any here as they become apparent)