TATOOINE INTERGOVERNMENTAL PANEL ON CLIMATE CHANGE ASSESSMENT REPORT 1: SUMMARY FOR TATOOINE POLICYMAKERS
I’ve wanted to do this for a while now.
In essence, for the last 5 or so years, Tatooine’s binary star system has come up as a talking point in one of my climate change science classes (yes, I’m a Star Wars fan). Basically, I use it to showcase an over-the-top example of radiative forcing. If you’re not familiar with this term, it’s basically a metric used to calculate net energetics in climate systems (expressed in Watts per square metre). For example, you can use it to measure how our pesky greenhouse gases contribute a positive radiative forcing by keeping heat energy within the Earth’s atmosphere; or how having an extra star would also definitely result in a significant positive RF effect.
Anyway, I guess in the back of my mind, I always thought it would be kind of fun to produce a comprehensive mock Intergovernmental Panel on Climate Change (IPCC) report, with a focus on our favourite desert planet Tatooine. Here, I would essentially use the exact IPCC text, but with some minor changes as well as modifying some of the figures so that they identify better with the Star Wars universe. Add to that, I thought it would be fun to incorporate an analogous anthropogenic emissions narrative: in this case, switch fossil fuel emissions due to our consumption needs and big oil antics, for increases in atmospheric water (also a greenhouse gas) due to unregulated for-profit water mining/extraction, and PUNCH IT CHEWIE, you have a desert planet in climate crisis!
All the more geeky when you consider I’ve specifically added a section on biodiversity effects (essentially, bye bye poor Sarlaccs), and have maintained the general tone of the IPCC which steadfastly avoids any political finger pointing (although, I’m sure it wouldn’t be difficult to come up with an intriguing narrative or two blaming the Hutts or even the Empire).
And why all the effort? Well, firstly, this stands as an admittedly elaborate teaching prop; but secondly, I hope this document entices folks to learn more about the real IPCC report. I get the sense that very few people have even heard of the IPCC, and maybe this even includes yourself. Which is a shame because it’s kind of important. In brief, it’s a document, organized by the United Nations, and prepared by a massive group of academics to try and objectively summarize all available research on climate change and its possible downstream effects. In other words, it’s the summation of decades of work by tens of thousands of very smart people, who are essentially telling you: (1) what the scientific evidence currently looks like; (2) what you might expect to happen in the Earth’s near future; and (3) what should people in influence (i.e. governments) consider doing in order to mitigate or adapt to these projections. Put another way, it’s definitely worth a few moments of your time, even if it is a bit of a sobering read.
All to say that if you think this Tatooine TIPCC document was kind of fun to look over (and note that Figure SPM.6 is probably the geekiest thing here), then I encourage you to take a peek at the real IPCC. There’s even official “easier to read” versions (the Summary for Policymaker files, or SPMs) for the two sections so far released. Do check them out by clicking 1 and 2.
(I should also note that this TIPCC document was put together relatively hastily. Most RF, temperature and emissions calculations were done “back of a napkin” style and obviously are hardly rigorous, if not prone to error (the expected RF variation due to a binary system for instance is something I have no clue about!) For that reason, I’m including links to the word doc, as well as a zipped keynote file used to make or tweak the diagrams. If you want to make the data more “robust,” or even add sections to the document, please do so, and add your name to the authorship section at the beginning).
– – –
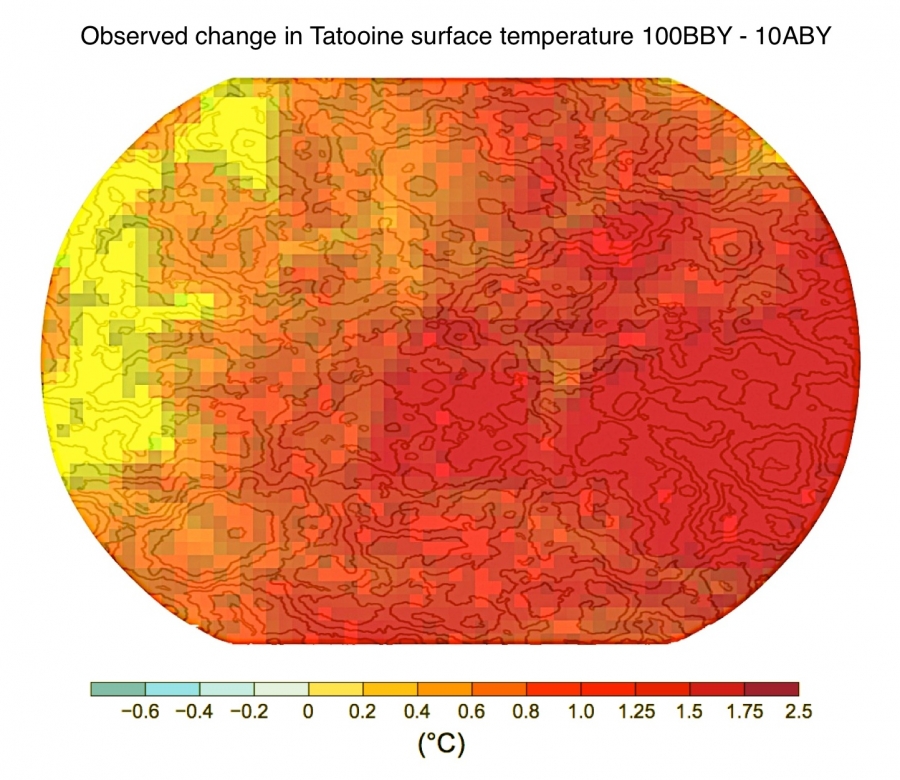
(Click on image to download TIPCC pdf)
Drafting Authors:
R1-G4, R2-D2, IT-O, A4-D, R-3PO, 4-LOM, R2-Q5, R2-R7, R2-Q2, TX-20, FA-4, R4-P17 R4-P44 R4-G9 R4-D5 R5-D4 R5-J2 R7-A7 R7-D4, C-3PO, K-3PO, TC-14, R-3PO, FX-9, David Ng (UBC, Canada)
This Summary for Policymakers should be cited as:
TIPCC AR1, 2014: Summary for Policymakers. Working Group to the First Assessment Report of the Tatooine Intergovernmental Panel on Climate Change, New Jedi University Press, Coruscant, Coruscant system, Core Worlds, Canada.
Pdf download: link (4.4Mb)
– – –
A. Introduction
The Working Group contribution to the TIPCC’s First Assessment Report (AR1) considers cumulative evidence of climate change based on many independent scientific analyses from observations of the climate system, paleoclimate archives, theoretical studies of climate processes and simulations using climate models. It represents a first concerted attempt to address the possible long term effects on the Tatooine geological and biodiversity systems, particularly as it pertains to the current unregulated practice of water mining.
This Summary for Policymakers (SPM) follows the structure of the Working Group report. The narrative is supported by a series of overarching highlighted conclusions which, taken together, provide a concise summary.
The degree of certainty in key findings in this assessment is based on the droid teams’ evaluations of underlying scientific understanding and is expressed as a qualitative level of confidence (from very low to very high) and, when possible, probabilistically with a quantified likelihood (from exceptionally unlikely to virtually certain). Confidence in the validity of a finding is based on the type, amount, quality, and consistency of evidence (e.g., data, mechanistic understanding, theory, models, expert judgment) and the degree of agreement.
Probabilistic estimates of quantified measures of uncertainty in a finding are based on statistical analysis of observations or model results, or both, and expert judgment. Where appropriate, findings are also formulated as statements of fact without using uncertainty qualifiers.
The basis for substantive paragraphs in this Summary for Policymakers can be found in the chapter sections of the underlying report and in the Technical Summary.
A.1 Treatment of Uncertainties in TIPCC AR1
The importance of consistent and transparent treatment of uncertainties is clearly recognized by the TIPCC in preparing its assessments of climate change. To promote consistency in the general treatment of uncertainty across this document as well as future ARs, droids have been asked to follow a brief set of guidance notes on determining and describing uncertainties in the context of an assessment.
The standard terms used to define levels of confidence in this report are as given in the TIPCC Uncertainty Guidance Note, namely:
Very high confidence (at least 9 out of 10 chance),
High confidence (about 8 out of 10 chance),
Medium confidence (about 5 out of 10 chance),
Low confidence (about 2 out of 10 chance), and
Very low confidence (about 1 out of 10 chance).
The standard terms used in this report to define likelihood of an outcome or result where this can be estimated probabilistically are:
Virtually certain (>99%),
Extremely likely (>95%),
Very likely (>90%),
Likely (>66%),
More likely than not (>50%),
About as likely as not (33 to 66%),
Unlikely (<33%),
Very unlikely (<10%)
Extremely unlikely (<5%),
Exceptionally unlikely (<1%)
B. Observed Changes in the Tatooine Climate System
Observations of the climate system are based on direct measurements and remote sensing from satellites and other platforms. Global-scale observations from the instrumental era began in the mid-19th century for temperature and other variables, with more comprehensive and diverse sets of observations available for the period 50BBY onwards. Paleoclimate reconstructions extend some records back hundreds to millions of years. Together, they provide a comprehensive view of the variability and long-term changes in the atmosphere and the land surface.
Warming of the climate system is unequivocal, and since the 50BBY, many of the observed changes are unprecedented over decades to millennia. The atmosphere has warmed, civilization released water vapour has increased significantly contributing to overall increase concentrations of greenhouse gases (see Figures SPM.1, SPM.2, and SPM.3)
B.1 Tatooine Atmosphere
Each of the last three decades has been successively warmer on Tatooine’s surface than any preceding decade since 100BBY (see Figure SPM.1 and SPM.2). In the Northern Hemisphere, 20BBY – 10ABY was likely the warmest 30-year period of the last 1400 years (medium confidence).
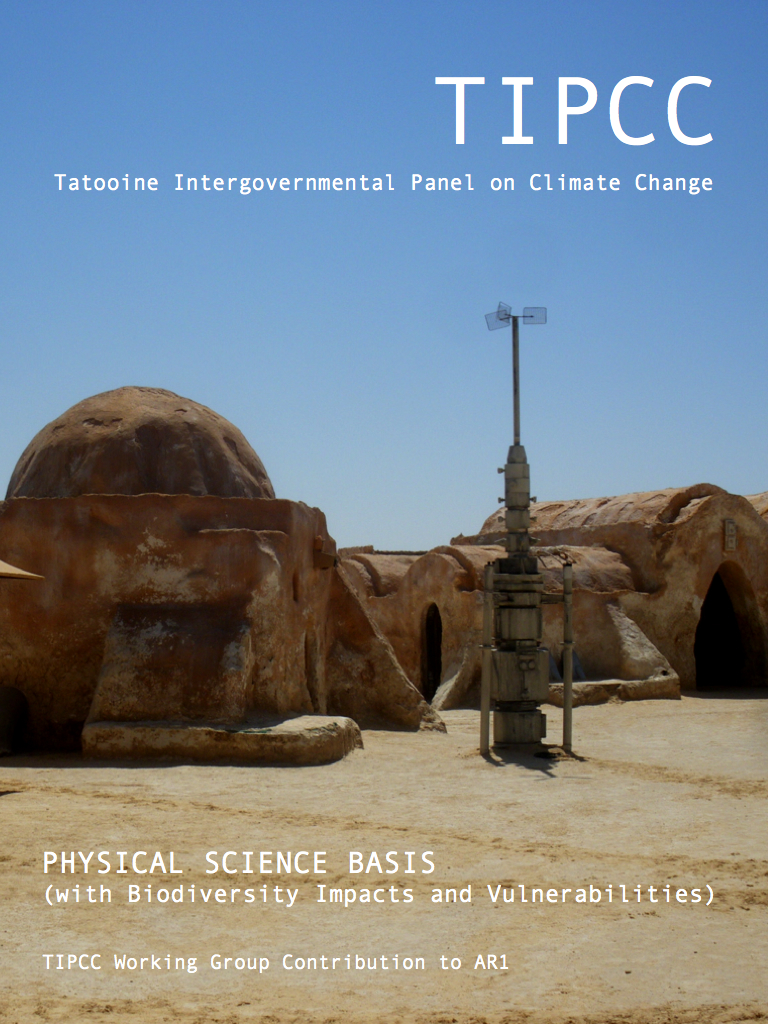
– For the longest period when calculation of regional trends is sufficiently complete (100BBY to 50BBY), almost the entire globe has experienced surface warming (see Figure SPM.1).
– The globally averaged combined land and ocean surface temperature data as calculated by a linear trend, show a warming of 0.85 [0.65 to 1.06] °C, over the period 120BBY to 10ABY, when multiple independently produced datasets exist. The total increase between the average of the 150BBY–100BBY period and the 0BBY–10ABY period is 0.78 [0.72 to 0.85] °C, based on the single longest dataset available (see Figure SPM.2).
– It is virtually certain that globally the troposphere has warmed since 50BBY. More complete observations allow greater confidence in estimates of tropospheric temperature changes in the extratropical Northern Hemisphere than elsewhere. There is medium confidence in the rate of warming and its vertical structure in the Northern Hemisphere extra-tropical troposphere and low confidence elsewhere.
– Changes in many extreme weather and climate events have been observed since about 50BBY. It is very likely that the number of cold days and nights has decreased and the number of warm days and nights has increased on the global scale. It is likely that the frequency of heat waves has increased in large parts of Northern Hemisphere. There are likely more land regions where the number of strong wind events has increased than where it has decreased. The frequency or intensity of strong winds has likely increased in 1000km radius around Mos Eisley. In other locations, confidence in changes in strong wind events is at most medium.
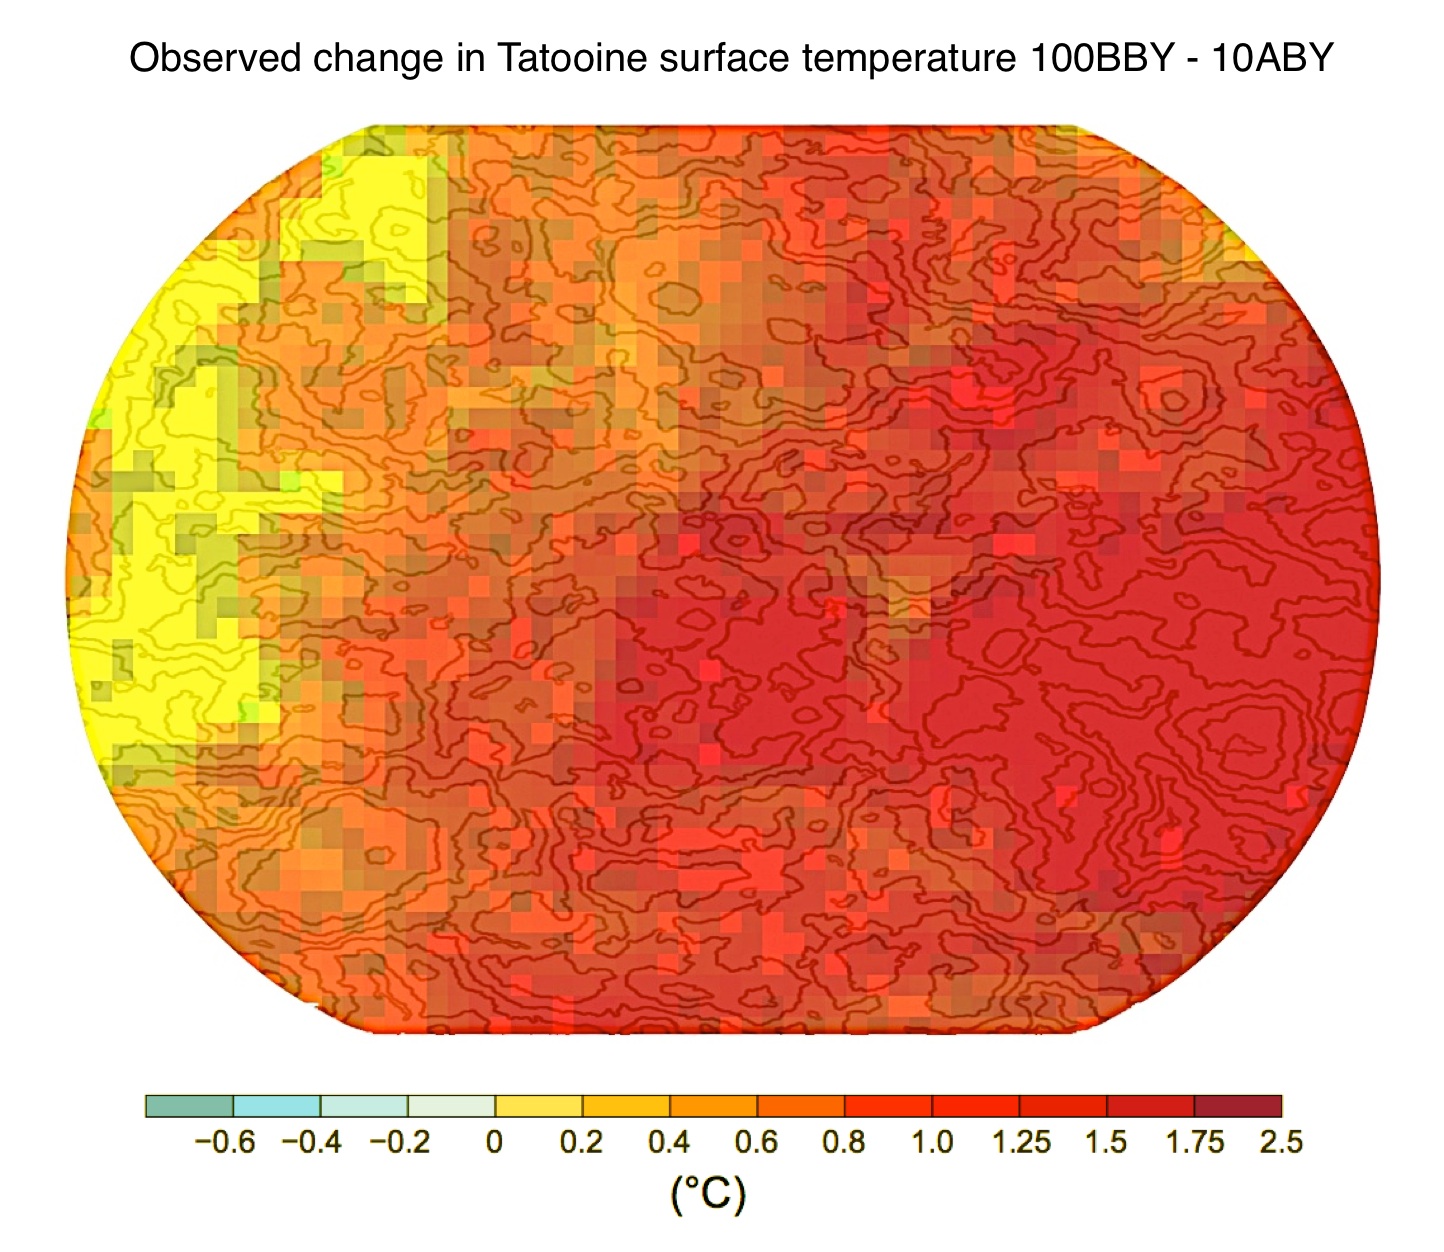
Figure SPM.1 (Click to Enlarge) Map of the observed surface temperature change from 100BBY to 10ABY derived from temperature trends determined by linear regression from one dataset (orange line in SPM.2). Trends were calculated where data availability permitted a robust estimate (i.e., all grid boxes had greater than 50% complete records and more than 20% data availability in the first and last 10% of the time period).
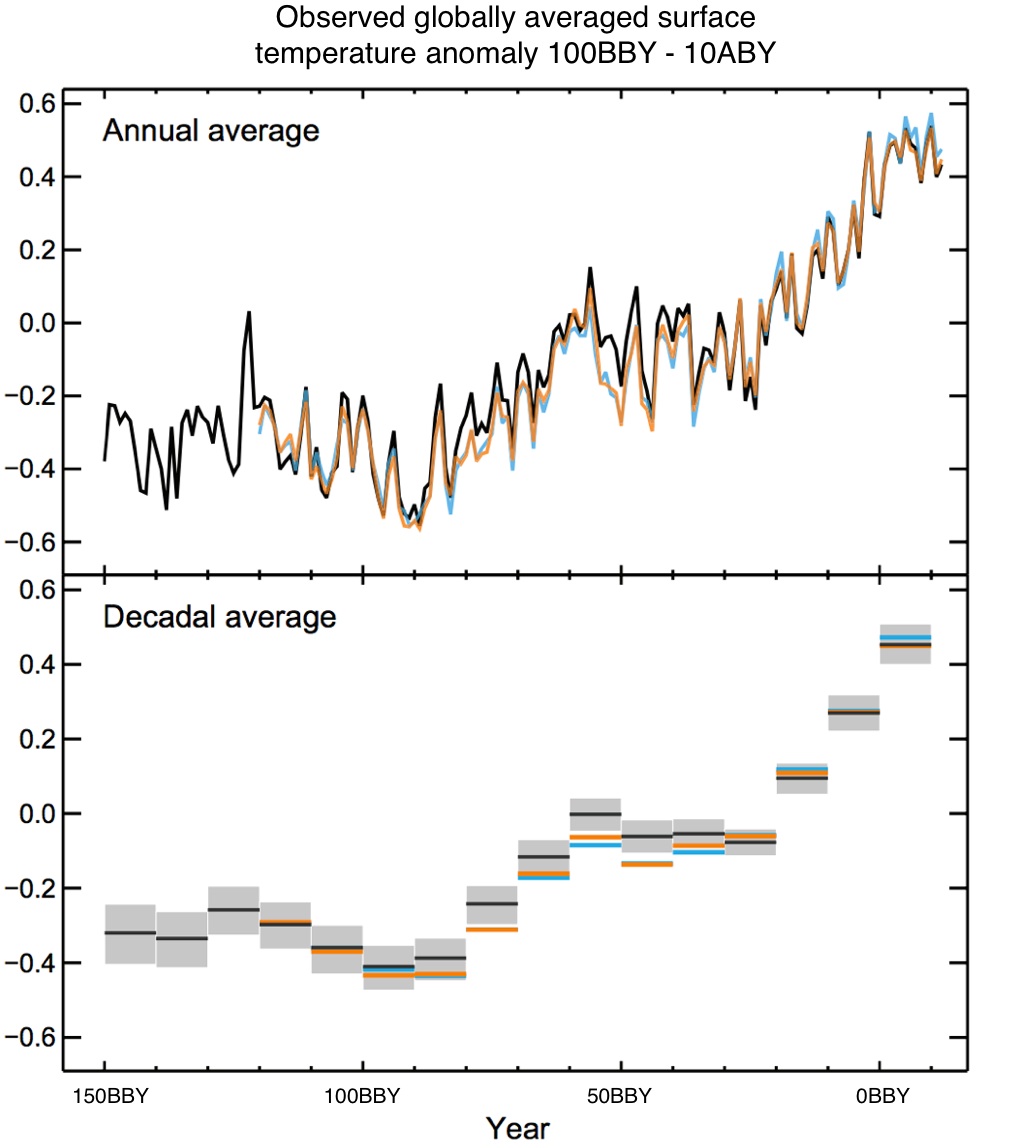
Figure SPM.2 (Click to Enlarge) Observed global mean combined atmospheric and land surface temperature anomalies, from 150BBY to 10ABY from three data sets. Top panel: annual mean values. Bottom panel: decadal mean values including the estimate of uncertainty for one dataset (black). Anomalies are relative to the mean of 75BBY – 25BBY.
B.2 Tatooine Water Cycle
The atmospheric concentrations of water, carbon dioxide, methane, and nitrous oxide have increased to levels unprecedented in at least the last 100,000 years. Water concentrations have increased by 40% since 50BBY, primarily from deregulation and corporatization of water mining practices.
– The atmospheric concentrations of the greenhouse gas water (H2O) has increased since 150BBY due to civilized activity. In 9ABY the concentrations of this greenhouse gas was 5112 ppm, and exceeded the pre-water mining deregulation levels by about 40%.
– Concentrations of H2O now substantially exceed the highest concentrations recorded in sand funnels during the past 500,000 years. The mean rates of increase in atmospheric concentrations over the past century are, with very high confidence, unprecedented in the last 22,000 years.
– Annual H2O escape emissions from water mining were 246 GtH2O yr–1 averaged over 0ABY – 10ABY (high confidence) and were 278 GtH2O yr–1 in 10ABY, 54% above the 30BBY level.
– From 50BBY to 10ABY, H2O escape emissions from water mining have released 12366 GtH2O to the atmosphere.
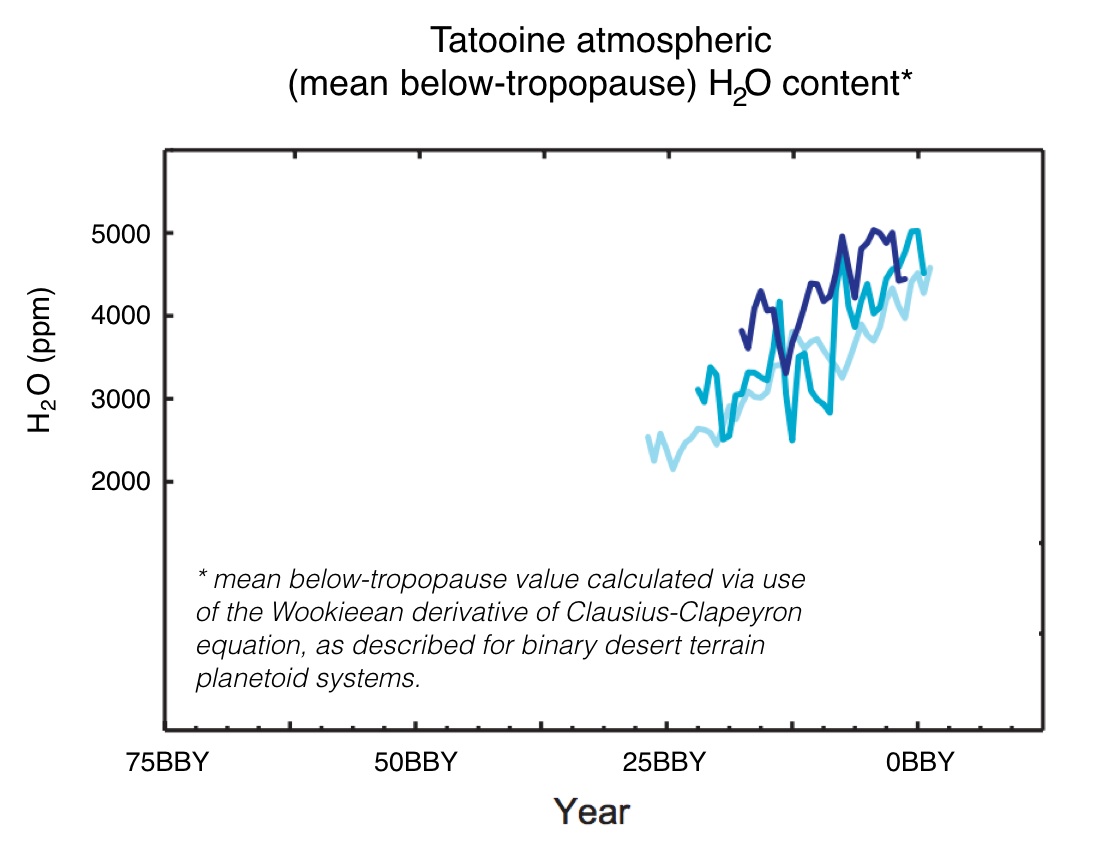
Figure SPM.3 (Click to Enlarge) Atmospheric concentrations of water (H2O) from Mos Eisley (dark blue), Douz outpost (medium blue), and Wayfar (light blue). Full details of the datasets shown here are provided in the underlying report and the Technical Summary Supplementary Material.
C. Drivers of Tatooine Climate Change
Natural and civilization based activity substances and processes that alter Tatooine’s energy budget are drivers of climate change. Radiative forcing (RF) quantifies the change in energy fluxes caused by changes in these drivers for 10ABY relative to 200BBY, unless otherwise indicated. Positive RF leads to surface warming, negative RF leads to surface cooling. RF is estimated based on in-situ and remote observations, properties of greenhouse gases and binary solar behaviour, and calculations using numerical models representing observed processes.
Total radiative forcing is positive, and has led to an uptake of energy by the climate system. The largest contributions to total radiative forcing is caused by the natural variations in solar energy and the water mining derived increase in the atmospheric concentration of H2O (see Figure SPM.4).
– The total civilization based RF for 10ABY relative to 200BBY is 8.57 W m−2 (see Figure SPM.4), and it has increased more rapidly since 50BBY than during prior decades. The total civilization based RF best estimate for 10ABY is 43% higher than that reported in 0BBY. This is caused by a combination of continued growth in H2O gas concentrations and improved estimates of downstream changes in other greenhouse gas concentrations.
– The RF from emissions of escaped water (H2O) for 10ABY relative to 200BBY is 5.98 [5.12 to 6.93] W m–2 (see Figure SPM.4).
– The total natural RF from solar irradiance changes is substantial and therefore, is carefully taken into account as a significant contribution to the net radiative forcing throughout the last century.
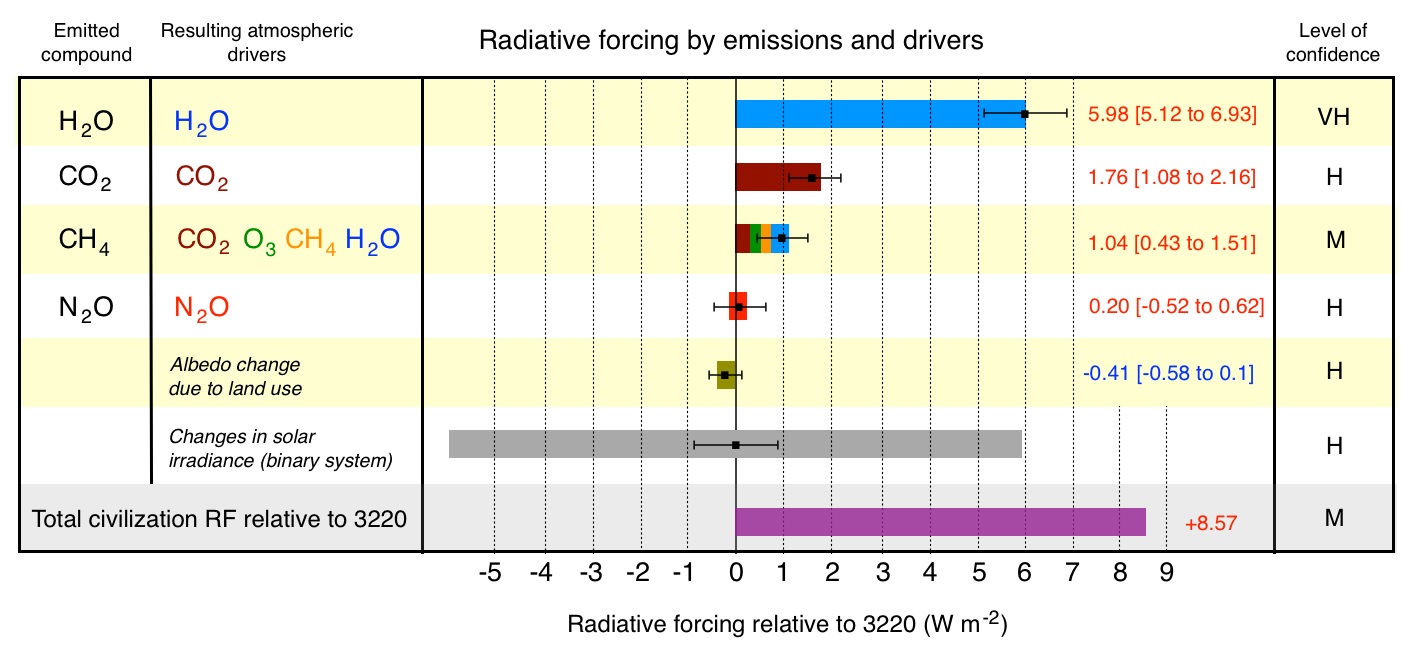
Figure SPM.4 (Click to Enlarge) Radiative forcing estimates in 10ABY relative to 200BBY and aggregated uncertainties for the main drivers of climate change. Values are global average radiative forcing (RF), partitioned according to the emitted compounds or processes that result in a combination of drivers. The best estimates of the net radiative forcing are shown as black circles with corresponding uncertainty intervals, the numerical values are provided on the right of the figure, together with the confidence level in the net forcing (VH – very high, H – high, M – medium, L – low, VL – very low).
D. Understanding the Tatooine Climate System
Understanding recent changes in the Tatooine climate system results from combining observations, studies of feedback processes, and model simulations. Evaluation of the ability of climate models to simulate recent changes requires consideration of the state of all modelled climate system components at the start of the simulation and the natural and civilization based forcing used to drive the models. Compared to previous studies, more detailed and longer observations and improved climate models now enable the attribution of a civilization based contribution to detected changes in more climate system components.
Civilization influence on the climate system is clear. This is evident from the increasing water concentrations in the atmosphere, positive radiative forcing, observed warming, and understanding of the climate system.
D.1 Evaluation of Tatooine Climate Models
Climate models have improved dramatically since previous studies. Models reproduce observed continental scale surface temperature patterns and trends over many decades, including the more rapid warming since 50BBY (very high confidence)
– The long-term climate model simulations show a trend in global-mean surface temperature from 50BBY to 10ABY that agrees with the observed trend (very high confidence). There are, however, differences between simulated and observed trends over periods as short as 10 to 15 years (e.g., 5BBY to 10ABY).
– On regional scales, the confidence in model capability to simulate surface temperature is less than for the larger scales. However, there is high confidence that regional-scale surface temperature is better simulated than at the time of previous studies.
– There has been substantial progress in the assessment of extreme weather and climate events since previous studies. Simulated global-mean trends in the frequency of extreme warm and cold days and nights over the second half of the 20th century are generally consistent with observations.
D.2 Quantification of Tatooine Climate System Responses
Observational and model studies of temperature change, climate feedbacks and changes in Tatooine’s energy budget together provide confidence in the magnitude of global warming in response to past and future forcing.
– The net feedback from the combined effect of changes in water vapour, and differences between atmospheric and surface warming is extremely likely positive and therefore amplifies changes in climate. Uncertainty in the sign and magnitude of possible cloud feedback is due primarily to continuing uncertainty in cloud formation processes.
– The equilibrium climate sensitivity quantifies the response of the climate system to constant radiative forcing on multi-century time scales. It is defined as the change in global mean surface temperature at equilibrium that is caused by a doubling of the atmospheric H2O concentration. Equilibrium climate sensitivity is likely in the range 1.5°C to 4.5°C (high confidence), extremely unlikely less than 1°C (high confidence), and very unlikely greater than 6°C (medium confidence). The lower temperature limit of the assessed likely range is thus less than 2°C, but the upper limit is the same. This assessment reflects improved understanding, the extended temperature record in the atmosphere and land surface, and new estimates of radiative forcing.
– The rate and magnitude of global climate change is determined by radiative forcing, climate feedbacks and the storage of energy by the climate system. Estimates of these quantities for recent decades are consistent with the assessed likely range of the equilibrium climate sensitivity to within assessed uncertainties, providing strong evidence for our understanding of civilization based climate change.
D.3 Detection and Attribution of Tatooine Climate Change
Water mining influence has been detected in the warming of the atmosphere and the land surface, in changes in the global water cycle, and in changes in some climate extremes. This evidence for civilization based influence has grown since 20BBY. It is extremely likely that influence from unregulated water mining has been the dominant cause of the observed warming since 50BBY
– It is extremely likely that more than three quarters of the observed increase in global average surface temperature from 50BBY to 10ABY was caused by the water mining increase in water gas concentrations and other civilization based forcings together. The best estimate of the water mining-induced contribution to warming is similar to the observed warming over this period.
– Escaped water gases contributed a global mean surface warming likely to be in the range of 0.5°C to 1.3°C over the period 50BBY to 10ABY, with the contributions from other anthropogenic forcings, including the cooling effect of aerosols, likely to be in the range of -0.6°C to 0.1°C. The contribution from natural forcings is likely to be in the range of -0.1°C to 0.1°C, and from natural internal variability is likely to be in the range of -0.1°C to 0.1°C. Together these assessed contributions are consistent with the observed warming of approximately 0.6°C to 0.7°C over this period, as calculated with consideration of solar irradiance cycles.
– It is very likely that water mining influence, particularly escaped water greenhouse gases has led to a detectable observed pattern of tropospheric warming since 60BBY.
E. Future Tatooine Climate Change and Effects
Projections of changes in the Tatooine climate system are made using a hierarchy of climate models ranging from simple climate models, to models of intermediate complexity, to comprehensive climate models, and Planetary System Models. These models simulate changes based on a set of scenarios of civilization based radiative forcings. These scenarios, the Representative Concentration Pathways (RCPs), was used for the new climate model simulations carried out under the framework of the Coupled Model Intercomparison Project Phase 2 (CMIP2) of the Core Worlds Climate Research Programme. In all RCPs, atmospheric H2O concentrations are higher in 100ABY relative to present day as a result of a further increase of cumulative emissions of H2O to the atmosphere during the next century. Projections in this Summary for Policymakers are for the end of 100ABY given relative to 20BBY to 10ABY, unless otherwise stated. To place such projections in historical context, it is necessary to consider observed changes between different periods. Based on the longest global surface temperature dataset available, the observed change between the average of the period 150BBY–100BBY and of the AR1 reference period is 0.61 [0.55 to 0.67] °C.
Continued unregulated/corporatized water mining and consequent emissions of escaped water will cause further warming and changes in all components of the climate system. Limiting climate change will require substantial and sustained reductions of water vapor emissions.
– Note that RCP5.98 represents a stoppage in water mining activities to allow for long term equilibrialization of atmospheric water amounts. RCP12.0 represents likely business as usual (BAU) models extrapolating water mining trends from 50BBY to present day. RCP8.5 and RCP7.0 represent various possible mitigation benchmarks under a BAU model.
E.1 Atmosphere: Temperature
Global surface temperature change for the end of the 100ABY century is likely to exceed 1.5°C relative to 150BBY to 100BBY for the RCP5.98 scenario. It is likely to exceed 4°C for RCP12.0. Warming will continue beyond 100ABY under all RCP scenarios except RCP5.98. Warming will continue to exhibit interannual-to-decadal variability and will not be regionally uniform.
– The global mean surface temperature change for the period 15ABY–30ABY relative to 10BBY-5ABY will likely be in the range of 0.3°C to 0.7°C (medium confidence). This assessment is based on multiple lines of evidence and assumes there will be no major volcanic eruptions or changes in predicted dynamic solar irradiance. Relative to natural internal variability, near-term increases in seasonal mean and annual mean temperatures are expected to be larger in the southern hemisphere than in the northern hemisphere (high confidence).
– Increase of global mean surface temperatures for 80ABY–100ABY relative to 10BBY–5ABY is projected to likely be in the ranges derived from the concentration-driven CMIP1 model simulations, that is, 0.3°C to 1.7°C (RCP5.98), 1.1°C to 2.6°C (RCP7.0), 1.4°C to 3.1°C (RCP8.5), 2.6°C to 4.8°C (RCP12.0).
– Relative to the average from year 1850 to 1900, global surface temperature change by the end of the 21st century is projected to likely exceed 1.5°C for RCP7.0, RCP8.5 and RCP12.0 (high confidence). Warming is likely to exceed 2°C for RCP8.5 and RCP12.0 (high confidence), more likely than not to exceed 2°C for RCP7.0 (high confidence), but unlikely to exceed 2°C for RCP5.98 (medium confidence). Warming is unlikely to exceed 4°C for RCP5.98, RCP7.0 and RCP8.5 (high confidence) and is likely to exceed 4°C for RCP12.0 (medium confidence).
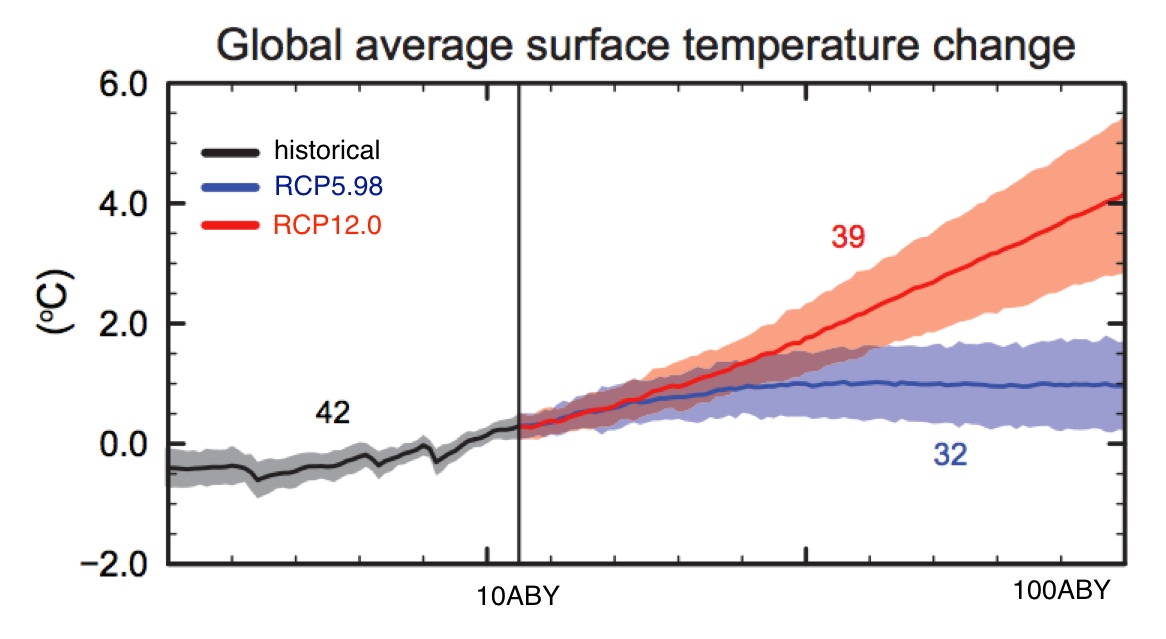
Figure SPM.5 (Click to Enlarge) CMIP5 multi-model simulated time series from 60BBY to 110ABY for change in global annual mean surface temperature relative to 10BBY-5ABY. Time series of projections and a measure of uncertainty (shading) are shown for scenarios RCP5.98 (blue) and RCP12.0 (red). Black (grey shading) is the modelled historical evolution using historical reconstructed forcings. For further technical details see the Technical Summary Supplementary Material.
E.2 Effects on Tatooine Biodiversity
A large fraction of terrestrial species face increased extinction risk under projected climate change during and beyond 100ABY, especially as climate change interacts with other stressors, such as habitat modification, over exploitation, and pollution (high confidence).
– Extinction risk is increased under all RCP scenarios, with risk increasing with both magnitude and rate of climate change. Many species will be unable to track suitable climates under mid- and high-range rates of Tatooine climate change (i.e., RCP7.0, 8.5, and 12.0) during the next century (medium confidence). Lower rates of change (i.e., RCP5.98) will pose fewer problems. See Figure SPM.6. Some species will adapt to new climates. Those that cannot adapt sufficiently fast will decrease in abundance or go extinct in part or all of their ranges. Management actions, such as maintenance of genetic diversity, assisted species migration and dispersal, manipulation of disturbance regimes (e.g., wind storms), and reduction of other stressors, can reduce, but not eliminate, risks of impacts to terrestrial ecosystem due to climate change, as well as increase the inherent capacity of ecosystems and their species to adapt to a changing climate (high confidence).
– Within the next century, magnitudes and rates of climate change associated with medium- to high-emission scenarios (RCP7.0, 8.5, and 12.0) pose high risk of abrupt and irreversible regional-scale change in the composition, structure, and function of terrestrial ecosystems, including low sand areas (medium confidence).
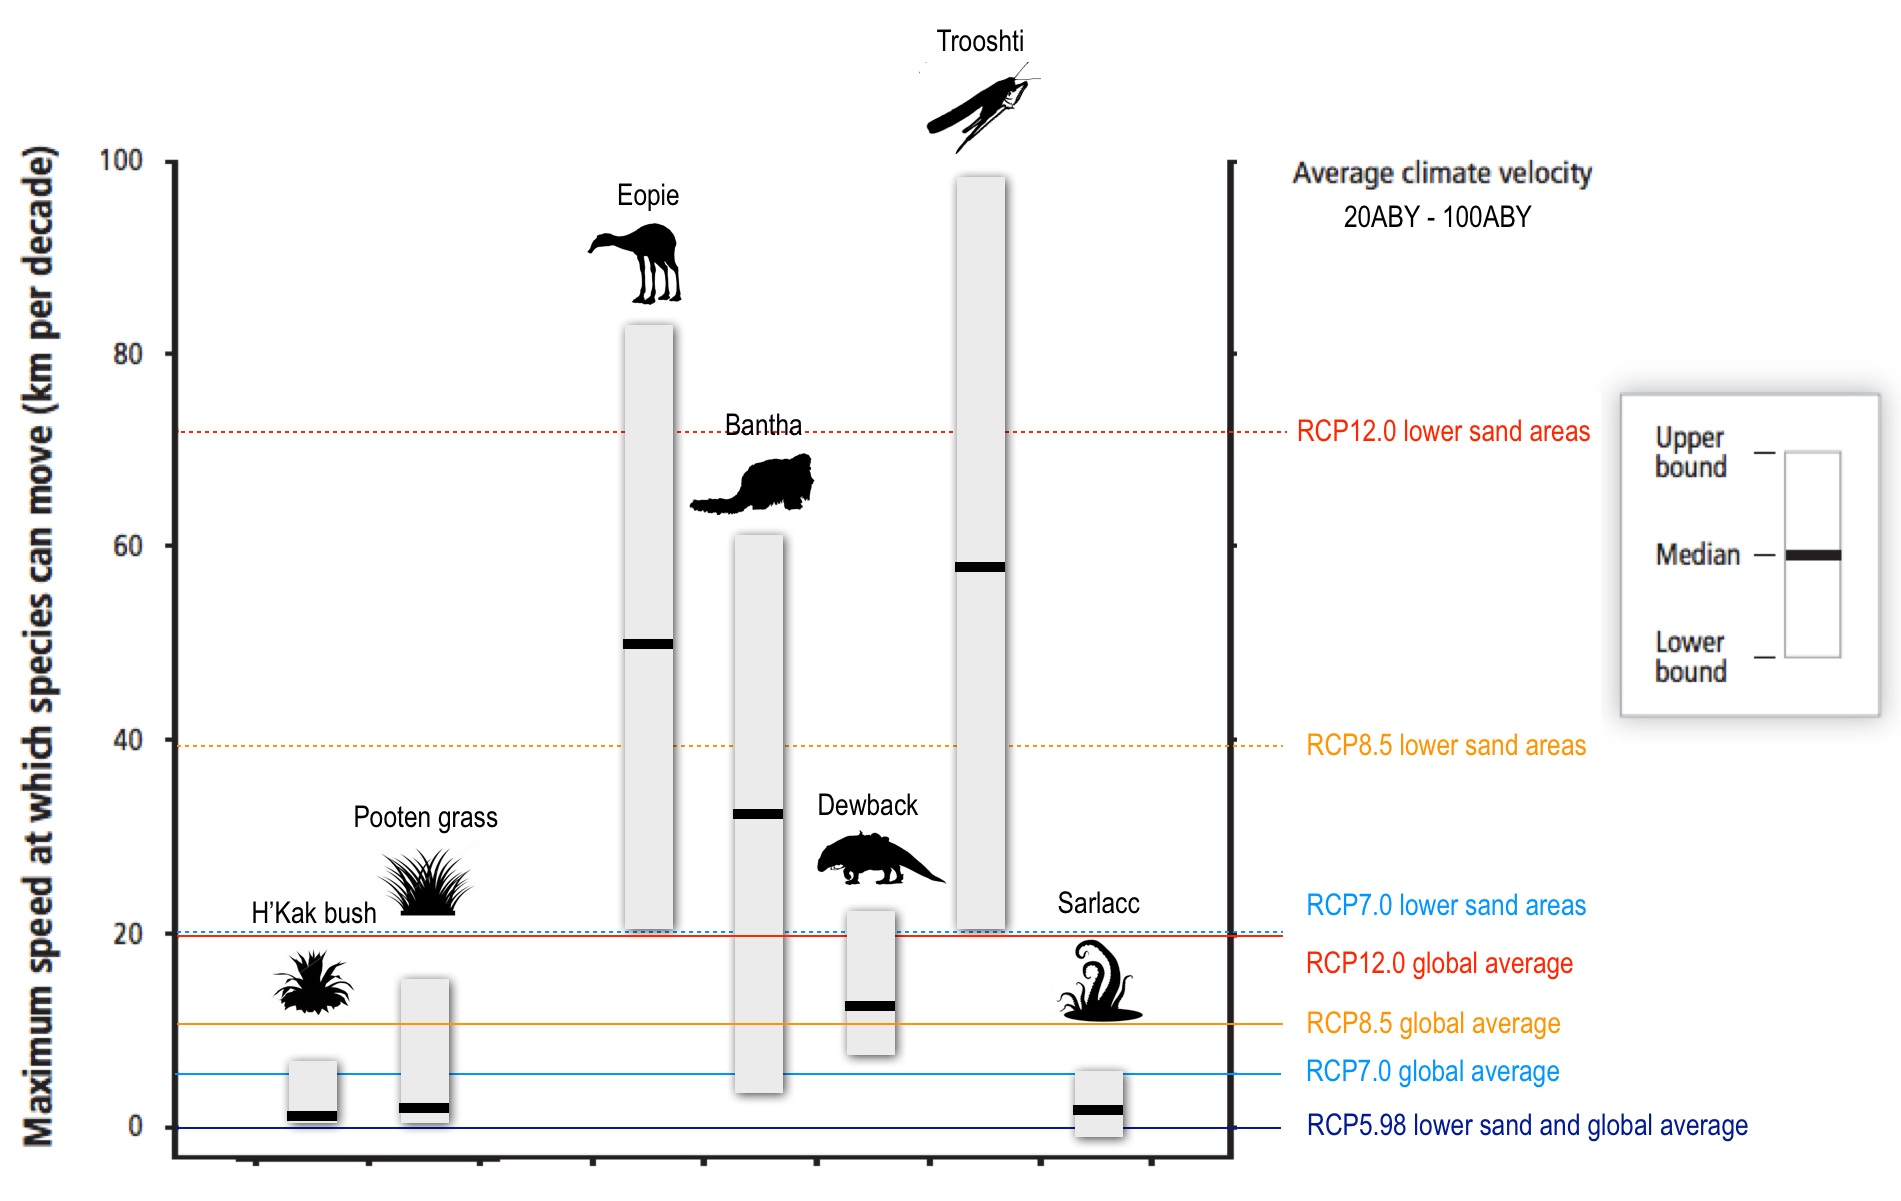
Figure SPM.6 (Click to Enlarge) Maximum speeds at which species can move across landscapes (based on observations and models; vertical axis on left), compared with speeds at which temperatures are projected to move across landscapes (climate velocities for temperature; vertical axis on right). Civilization based interventions, such as transport or habitat fragmentation, can greatly increase or decrease speeds of movement. White boxes with black bars indicate ranges and medians of maximum movement speeds for various representative Tatooine biodiversity. For RCP5.98, 7.0, 8.5, and 12.0 for 20ABY–100ABY, horizontal lines show climate velocity for the global-land-area average and for large flat regions. Species with maximum speeds below each line are expected to be unable to track warming in the absence of intervention.
E.3 Tatooine Climate Stabilization, Climate Change Commitment and Irreversibility
Cumulative emissions of H2O largely determine global mean surface warming by 0BBY century and beyond. Most aspects of climate change will persist for many centuries even if water mining and subsequent emissions of H2O are stopped. This represents a substantial multi-century climate change commitment created by past, present and future emissions of H2O.
– Cumulative total emissions of H2O and global mean surface temperature response are approximately linearly related. Any given level of warming is associated with a range of cumulative H2O emissions, and therefore, e.g., higher emissions in earlier decades imply lower emissions later.
– Limiting the warming caused by water mining based H2O emissions alone with a probability of >33%, >50%, and >66% to less than 2°C since the period 150BBY – 100BBY, will require cumulative H2O emissions from all anthropogenic sources to stay between 0 and about 40133 GtH2O, 0 and about 33688 GtH2O, and 0 and about 27392 GtH2O since that period, respectively.
– A large fraction of civilization based climate change resulting from H2O emissions is irreversible on a multi-century to millennial time scale, except in the case of a large net removal of H2O from the atmosphere over a sustained period. Surface temperatures will remain approximately constant at elevated levels for many centuries after a complete cessation of net civilization based H2O emissions. Due to the long time scales of heat transfer from the land surface to deep sand, terrain warming will continue for centuries. Depending on the scenario, about 15 to 40% of emitted H2O will remain in the atmosphere longer than 1,000 years.
– Currently, model projections suggest a possibility (low confidence) of a irreversible global mean temperature rise that will continue beyond 100ABY. The few available model results that go beyond 100ABY indicate global mean temperature rise by 200ABY to temperatures reaching beyond all Tatooine biodiversity thresholds (medium confidence).
– – –
With apologies to:
IPCC, 2013: Summary for Policymakers. In: Climate Change 2013: The Physical Science Basis. Contribution of Working Group I to the Fifth Assessment Report of the Intergovernmental Panel on Climate Change [Stocker, T.F., D. Qin, G.-K. Plattner, M. Tignor, S.K. Allen, J. Boschung, A. Nauels, Y. Xia, V. Bex and P.M. Midgley (eds.)]. Cambridge University Press, Cambridge, United Kingdom and New York, NY, USA
IPCC, 2014: Summary for policymakers. In: Climate Change 2014: Impacts, Adaptation, and Vulnerability. Part A: Global and Sectoral Aspects. Contribution of Working Group II to the Fifth Assessment Report of the Intergovernmental Panel on Climate Change [Field, C.B., V.R. Barros, D.J. Dokken, K.J. Mach, M.D. Mastrandrea, T.E. Bilir, M. Chatterjee, K.L. Ebi, Y.O. Estrada, R.C. Genova, B. Girma, E.S. Kissel, A.N. Levy, S. MacCracken, P.R. Mastrandrea, and L.L. White (eds.)]. Cambridge University Press, Cambridge, United Kingdom and New York, NY, USA, pp. 1-32.
– – –
More on Tatooine science via the below carnival!
-
Why a Bunch of Science Writers Are Writing About a Fictional Planet – Matt Shipman
-
Functional Anatomy of Tatooine Megafauna (Hyperspace Transmission Received) – John Hutchinson
-
Science of Tatooine: Water – Adrienne Roehrich
-
Cascading planetary-wide ecosystem effects of the extirpation of apex predatory Krayt dragons on Tatooine– David Shiffman
-
The Limits of Animal Life on Tatooine – Maggie Koerth-Baker
- Tatooine’s tangled bank – plants evolve in a galaxy far, far away — Malcolm Campbell
- Diary of an Interplanetary Naturalist – The Sarlacc — Joe Hanson
