FLOW CYTOMETRY: A TECHNOLOGY TO COUNT AND SORT CELLS
(August, 2003)
Flow cytometry is a technology that allows a single cell to be measured for a variety of characteristics, determined by looking at how they flow in liquid [1]. Instruments used for this can gather information about cells by measuring visible and fluorescent light emissions, allowing cell sorting based on physical, biochemical and antigenic traits.
Flow Cytometers
A flow cytometer, sometimes called a Fluorescence Activated Cell Sorter (FACS), has several key components [2] (see Figure 1):
1. A light or excitation source, typically a laser that emits light at a particular wavelength; 2. A liquid flow that moves the suspended cells through the instrument and past the laser; and 3. A detector, in this case a photomultiplier tube, which is able to measure the brief flashes of light emitted as cells flow past the laser beam.
In a flow cytometer, single cells move past the excitation source and the light hitting the cells is either scattered or absorbed and then re-emitted (fluorescence). This scattered or re-emitted light is collected by the detector (see Figure 2).
Light Scatter
Scattered light is a consequence of a light beam making contact with a cell, resulting in either reflected or refracted light reaching the detector. The pattern of light scattering is dependent on cell size and shape [1,2], giving relative measures of these cellular characteristics as cells flow through the beam. This can be quite useful, as cells can be sorted on the basis of size or shape to different collection tubes using a technique called electrostatic deflection, which employs charged plates to change the path of the cell [2] (see Figure 2).
Fluorescence
Fluorescence-based detection depends on the absorption of light by the cell and the subsequent re-emission of this light at a different frequency. Flow cytometers make use of this technology by employing filters to block the original light source from reaching the detector, while the fluorescence emission is allowed through for detection, which allows only a very low background of stray light to reach the detector [2].
In flow cytometry experiments, fluorescence is often achieved by the deliberate labeling of a cellular component using a fluorescent marker, usually a type of dye [3]. These dyes fluoresce only when light of the appropriate wavelength (specified by the frequency of the laser) hits them, causing the emission of secondary light at a different wavelength. Detection of the second wavelength is used as a measure of the presence of the dye on the cell and thus the component it is labeling.
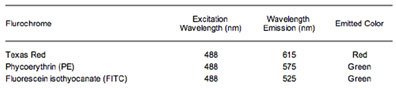
Various fluorescent dyes are commercially available [4] and their emitted colors are reminiscent of the reds and greens seen in fireworks. The most common fluorescent dyes are Texas-Red, fluorescein isothiocyanate (FITC) and phycoerythrin (PE). Table 1 shows some of the different fluorochromes, their excitation and emission wavelengths, and their emission color.
Display and Interpretation of Flow Cytometry Data
The amount a cell scatters or fluoresces light is measured by the detector and subsequently need to be displayed for interpretation [1,2,5]. These profiles of cells are normally displayed as dot plots or histograms [5].
Dot plot displays use two parameters to graph the data generated by flow analysis, with each dot representing the passage of one cell through the detector (see Figure 3). The X- and Y-axes measure the different emissions, displaying a dot for each of the cells that show that particular emission. In Figure 3, the dot blot shows an example where two populations of cells have been analyzed by flow cytometry. A cell of a particular population type will show up as a dot in the quadrant of the dot plot designated for that population.
Histograms can also be used to display data from flow cytometry experiments. In these plots the X-axis shows the intensity of the detected signal and the Y-axis measures the number of events (cells) counted. Histograms often display the output of two (or more) samples using a single fluorochrome. In an experiment determining the presence or absence of a particular cell marker or a relative increase or decrease of a marker after experimental treatment, a histogram shows the shift in the fluorescence intensity of the sampled cells (see Figure 4).
Applications of Flow Cytometry
Flow cytometry is used in a variety of different fields including immunology, pathology and medicine, all the way to plant breeding [5-7]. A few of the most common applications are listed below:
DNA Content
Fluorescence staining of DNA followed by flow analysis has been used to determine a cell’s DNA content [8]. Stained cells with one copy of their genetic material (a haploid cell) will be half as bright as cells with two copies (a diploid cell). A cell varies between these states during the cell cycle and flow cytometry can be used to determine its position in the cell cycle based on its DNA content.
Evaluation of Cell-Surface Markers
Immunologists frequently use flow cytometry to determine the types of markers and receptors on the surface of a cell. For these experiments, a fluorescent dye is attached to antibodies or receptor ligands [3]. These cells can then be subjected to flow cytometry and the amount of the receptor on their surface detected as a level of fluorescence.
These experiments can be designed to incorporate more than one fluorescent marker at a time, giving the ability to detect multiple cell-surface markers simultaneously. Building upon the example of staining for particular markers or receptors, staining with more than one fluorescence dye allows researchers to determine whether there are populations of cells that contain multiple receptors.
A specific example is the analysis of the markers on T-cells. T-cells are a type of immune cell, which have cell surface marker proteins known as CD4 and CD8. In mammals there are T-cells that are CD4 positive, cells that are CD8 positive and cells that are positive for both markers. To determine the relative abundance of cells carrying the different markers, FITC-attached CD4 antibodies (normally termed FITC-conjugated CD4 antibodies) and Texas Red-conjugated CD8 antibodies could be incubated with T-cells. In flow cytometry analysis cells that were CD4 positive fluoresce green, while cells that were CD8 positive fluoresce red and cells that were positive for both markers give off green and red light (see Figure 5). Detection of the levels of each fluorescent color would give a measure of how many of each type of T-cell was present in the original mixture.
Cell Sorting
Flow cytometry can be used to select and purify a specific subset of cells within a population [6,7] (see Figure 2). This is a popular application with researchers, since it allows the selection of cells expressing a particular receptor, in a phase of the cell cycle, or perhaps expressing a particular transgenic protein, followed by the culture of these cells as a pure population. Amazingly, a FACS can sort cells as fast as 15,000 cells/sec with very high purity (over 98%).
Texts Consulted and Additional Reading
1. Nunez R. 2001. Flow Cytometry for Research Scientists: Principles and Applications. Wymondham, Norfolk, UK: Horizon Press. 110p.
2. Tsieh S. 2002. Flow Cytometric Analysis of Hematologic Neoplasms: A Color Atlas & Text. Philadelphia: Lippincott Williama & Wilkins. 276p.
3. Stewart CC, Nicholson JKA, eds. 2000. Immunophenotyping. New York: Wiley-Liss. 442p.
4. A list of flow Cytometry links on the web
References
1. Givan A. 2001. Flow Cytometry: First Principles. New York: Wiley-Liss. 273p.
2. Owens MA, Loken MR. 1995. Flow Cytometry: Principles for Clinical Laboratory Practice. New York: Wiley-Liss. 288p.
3. Roederer M. 1997. Conjugation of monoclonal antibodies.
4. Molecular Probes Handbook.
5. Recktenwald DJ. 1993. Introduction to Flow Cytometry: Principles, Fluorochromes, Instrument Set-Up, Calibration. J Hematotherapy 2(3): 387-94.
6. Marti GE, Stetler-Stevenson M, Bleesing JJ, Fleisher TA. 2001. Introduction to Flow Cytometry. Sem Hematology 38(2): 93-9.
7. Weaver JL. 2000. Introduction to Flow Cytometry. Methods 21(3): 199-201.
8. Ross JS. 1996. DNA Ploidy and Cell Cycle Analysis in Pathology. New York: Igaku-Shoin.
(Art by Jane Wang – note that high res versions of image files available here)