The Definitive Halloween Candy Hierarchy
A HISTORY
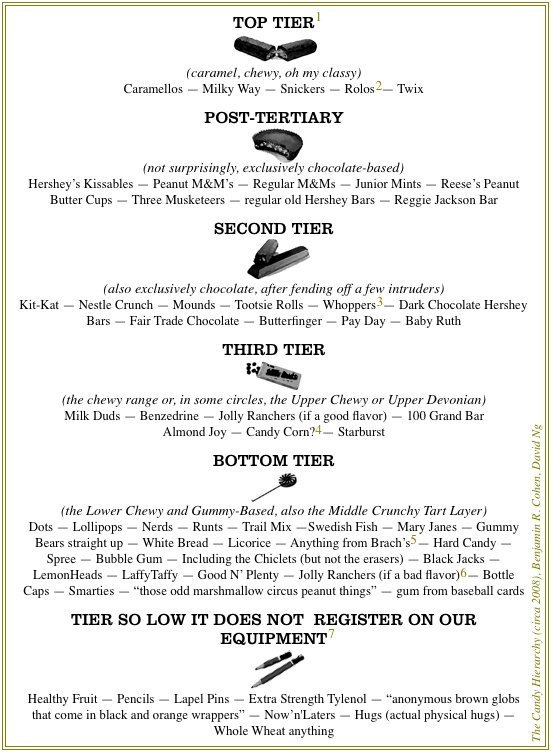
It began, as all things do, with a geology joke. We ranked candy based on their ability to elicit “joy” or “despair” and then worked in that ranking in various geological strata, both real and imagined. The strata, not the ranking. This started in 2006, and grew from there. At the beginning, we compiled years of lived experience into a hierarchy of candy preference for Halloween. Not all candy. Not all times. But for trick or treating purposes.
Let’s talk candy rankings, seriously, which have become a kind of cottage industry in the last decade’s social-media age of the internet. In fact, candy rankings and arguments over their perceived accuracy might be the perfect distillation of what a certain kind of internet is good for. It lets people argue over opinion; its conclusions thus have to be constantly modified and adjusted; also there are no conclusions, of course, because it is a fickle game of idle speculation; it’s low stakes fun; and reasonable people can disagree with unreasonable arguments. These are great things for hashing out the enjoyment of various shapes of sugar. Good on you, social media. They are not necessarily great things that go beyond idle speculation, for actual democratic society, for governance or policy or the protection of human dignity. Oh and by the way, always make sure you vote.
Candy, though. And Halloween. There will be rankings (immediately below), then deliberations on history (further below) and a beautiful chart (at the top and below). There is a hierarchy. We are making our priority claim. Why does this sound like an academic abstract?
 (Click on thumbnail image for full page pdf poster)
DISCUSSION
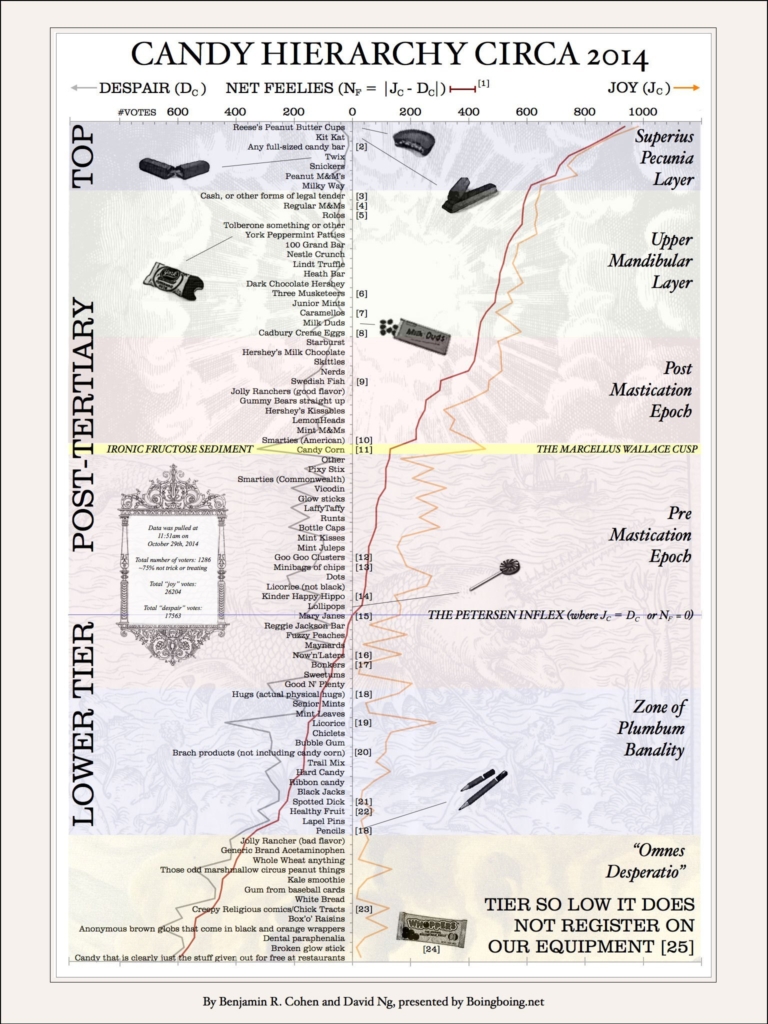
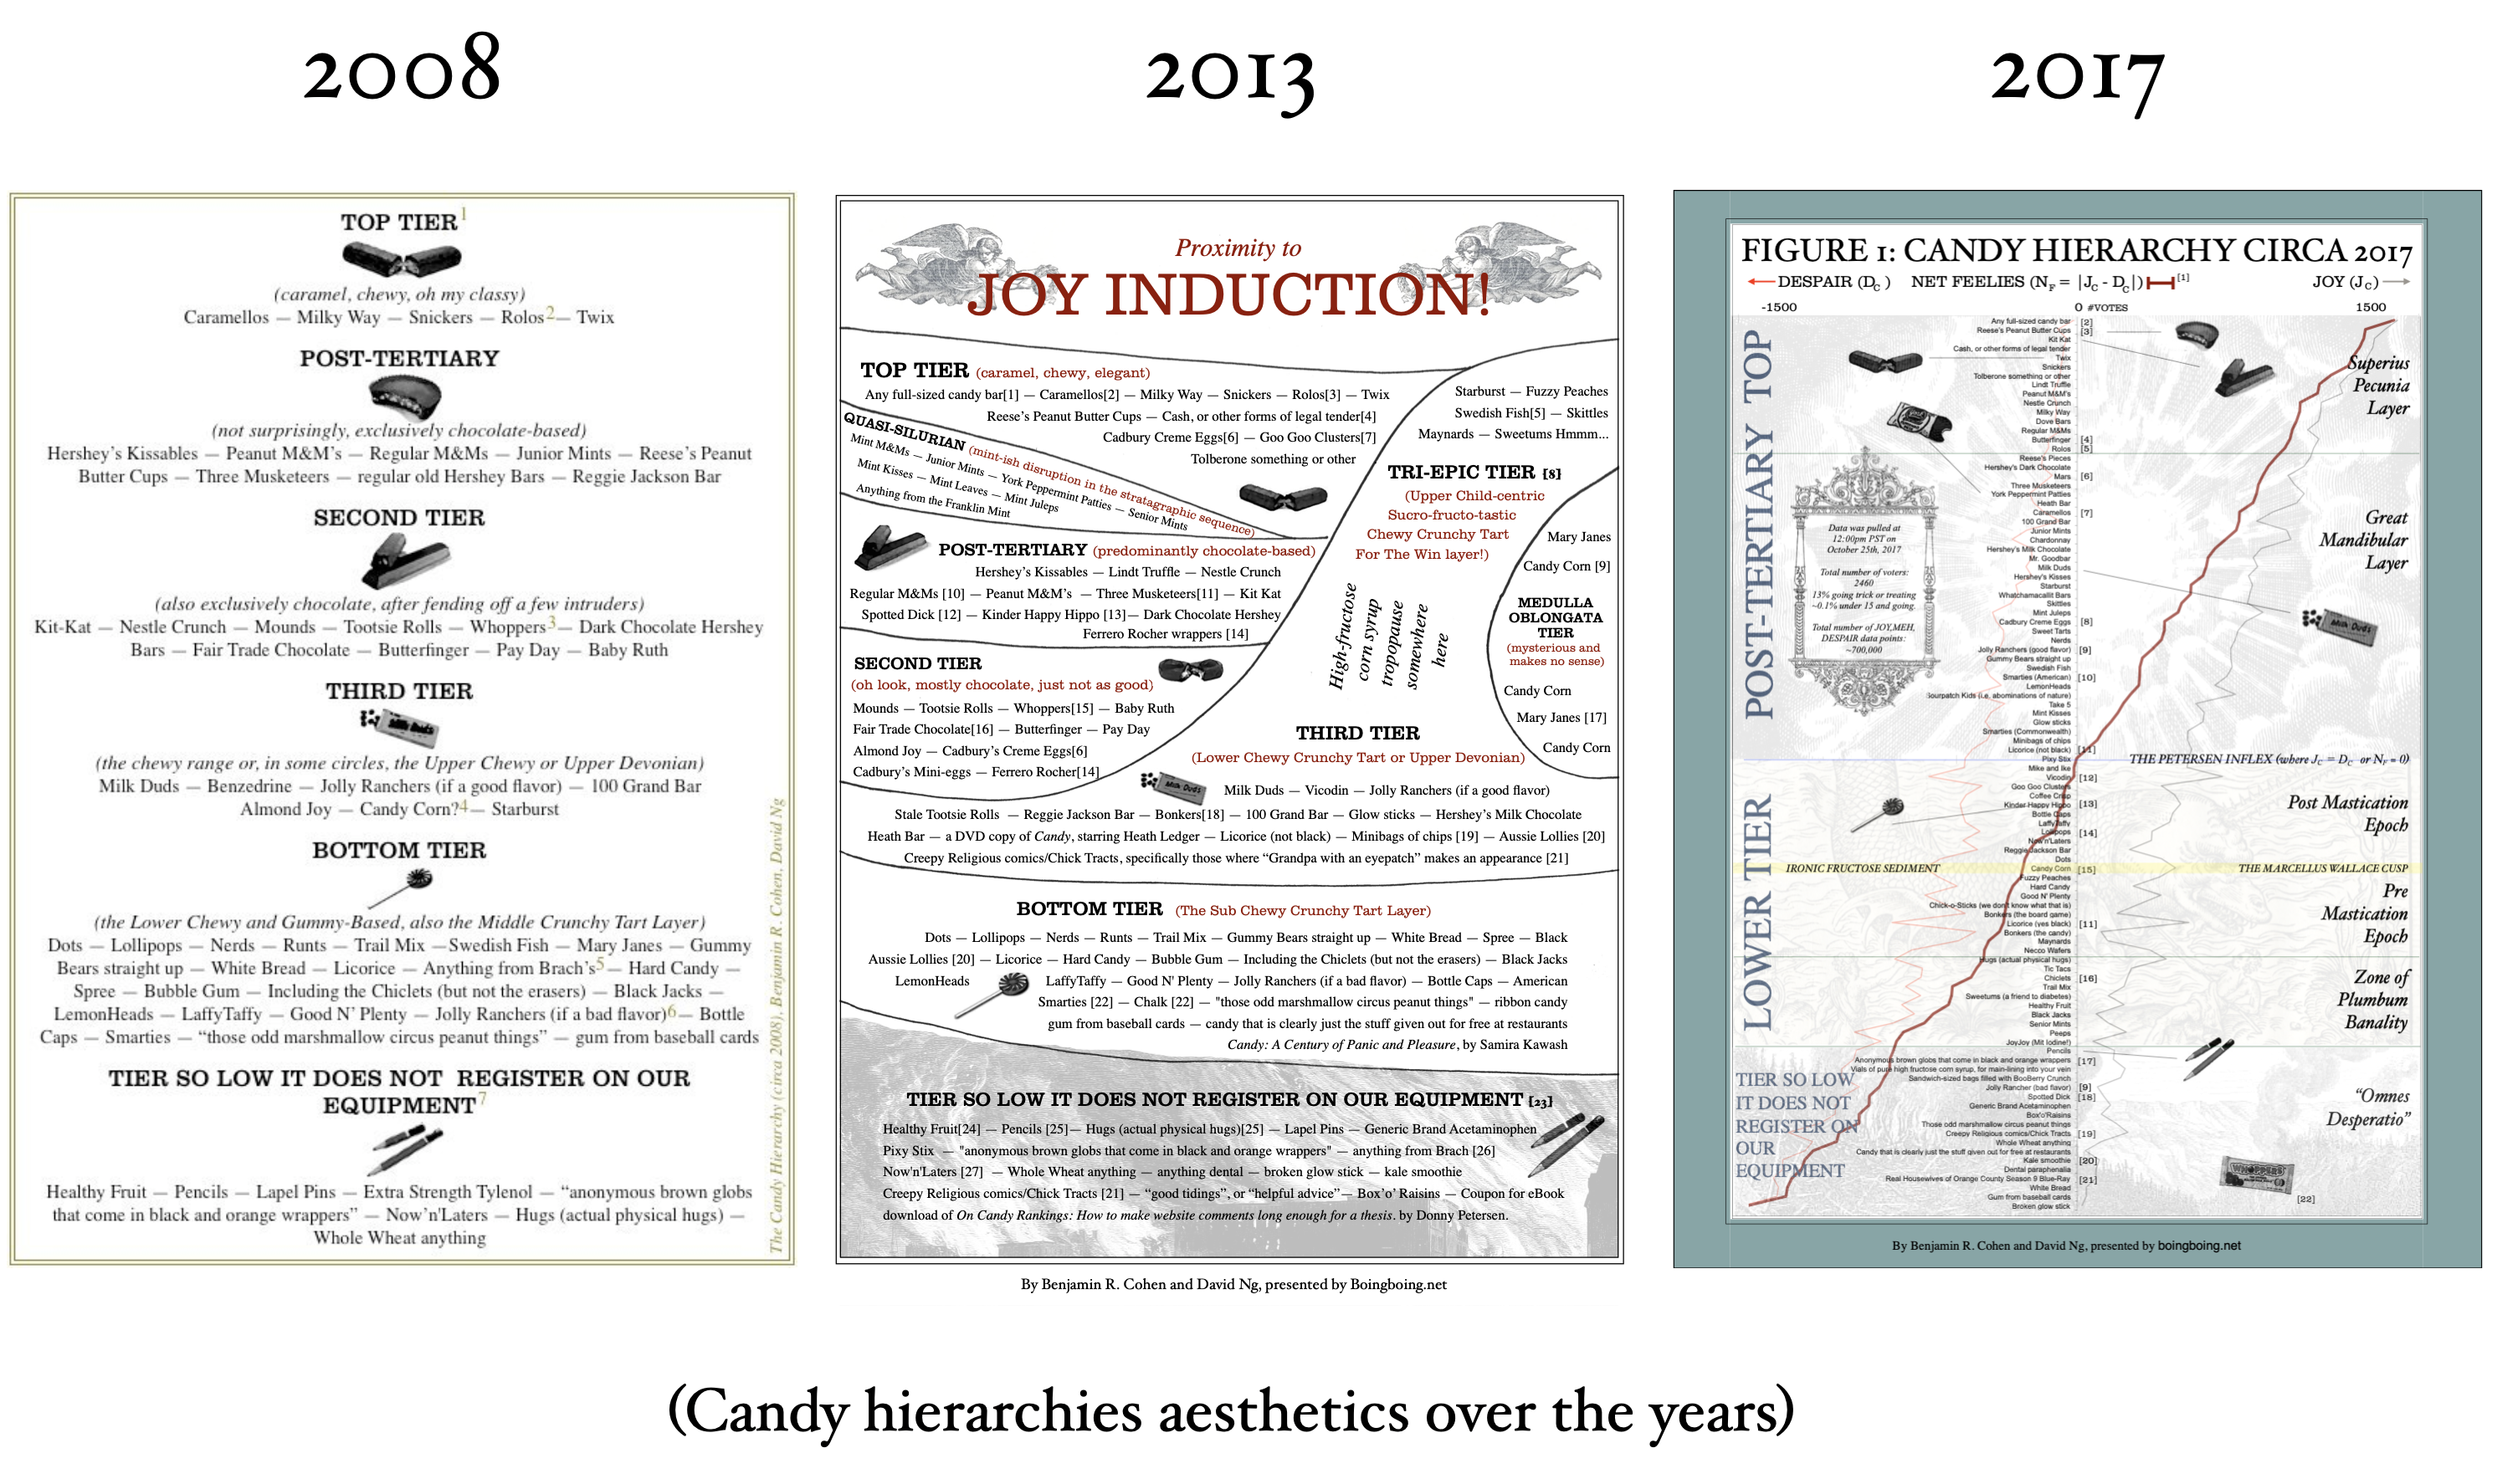
We revised the original hierarchy each year between 2006 and 2009 to include feedback from readers and onlookers back at our now gone blog The World’s Fair. (Younger readers can google “blog.”) We then moved here to BoingBoing to find an audience eager to debate the proper order of candy enjoyment. The 2010-2013 versions were fine, they were fine. Then in 2014 we added legitimate reader contributions in the form of a not-quite-social-science-legit survey. But legit enough for talking candy. On a website. For idle speculation. That we could then make a big deal of off-line. With disproportionate certainty.
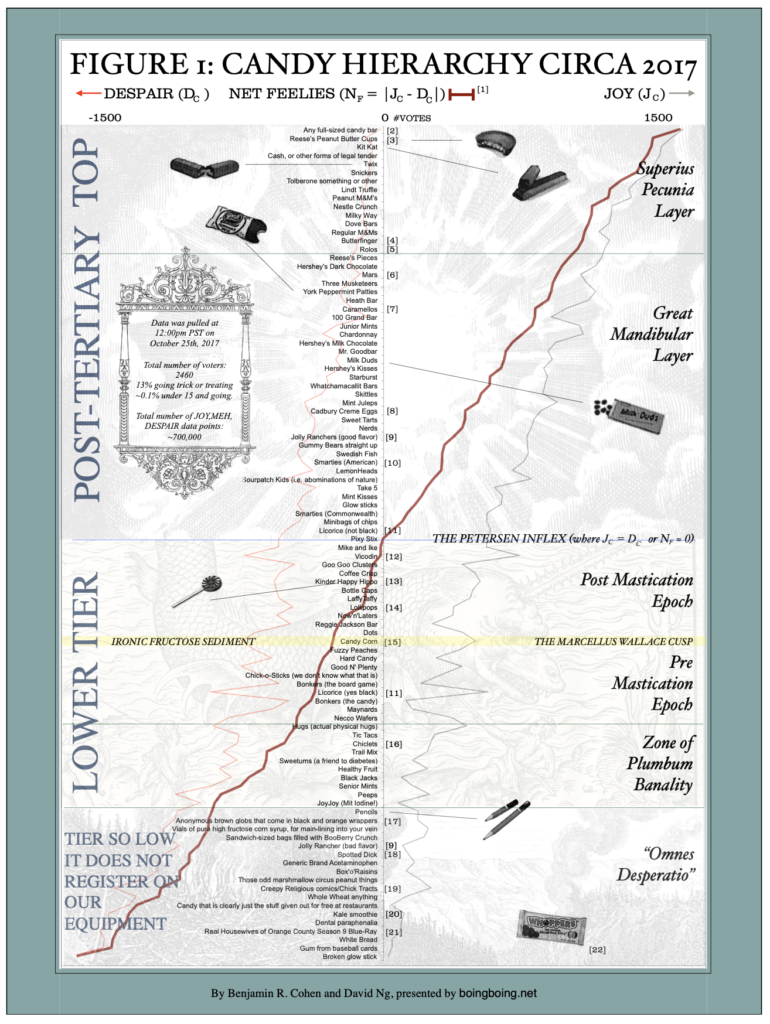
The 2006 original had a distinct top stratum, four of which were Snickers, Milky Way, Reese’s Peanut Butter Cups, and Twix. The 2014 data—the first of many sets actually defined by survey results—showed pretty much the same thing in the top tier, give or take. The four revisions between 2014 and 2017 likewise didn’t much change. Data coalesced. That’s our big conclusion. Admitting the very Western bias of the survey, you find a notably stable Top 10 and a Very Stable Top 5. Obviously “any full-sized candy bar” will always rank at the top. “Cash or other legal tender” remains popular.
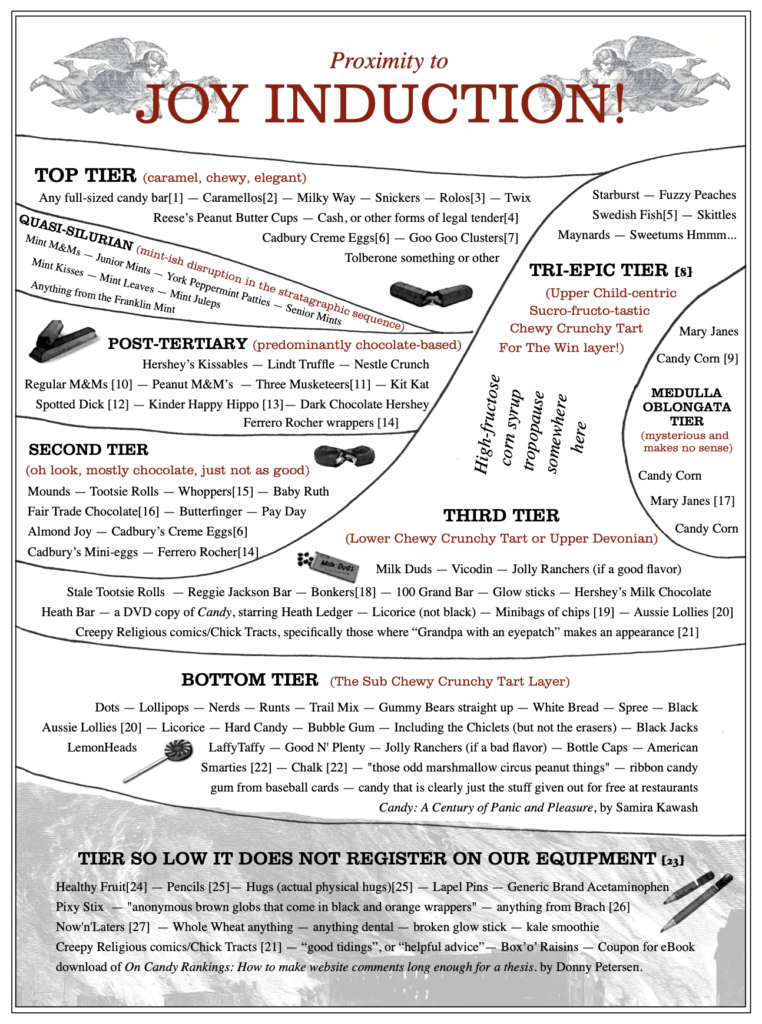
So it’s true that for specific candies (not counting cash and the full-sizers you get from the house with the Beamer in the drive) we discovered what scholars call The Classic Quartet: Reese’s Peanut Butter Cups, Snickers, Twix, and Kit Kat. Toblerone keeps edging into a top 5 and you get those Lindt Truffles that nobody actually buys but still somehow sit high up the hierarchy. You’re gonna get your Milky Ways (the allergic kid’s Snickers), your Butterfingers, your Peanut M&Ms (always outranking plain). Since Rolo’s can be rolled to a friend, they too hang in the upper strata. And, surprisingly to many aficionados, a Nestle Crunch always finds its way hanging in top strata too.* (On the bottom deep earth side, white bread, gum from baseball cards, broken glow sticks, and dental paraphernalia are perennial un-satisfieds, so much so that after many years not a single person has cared to point out we consistently misspelled paraphernalia.)
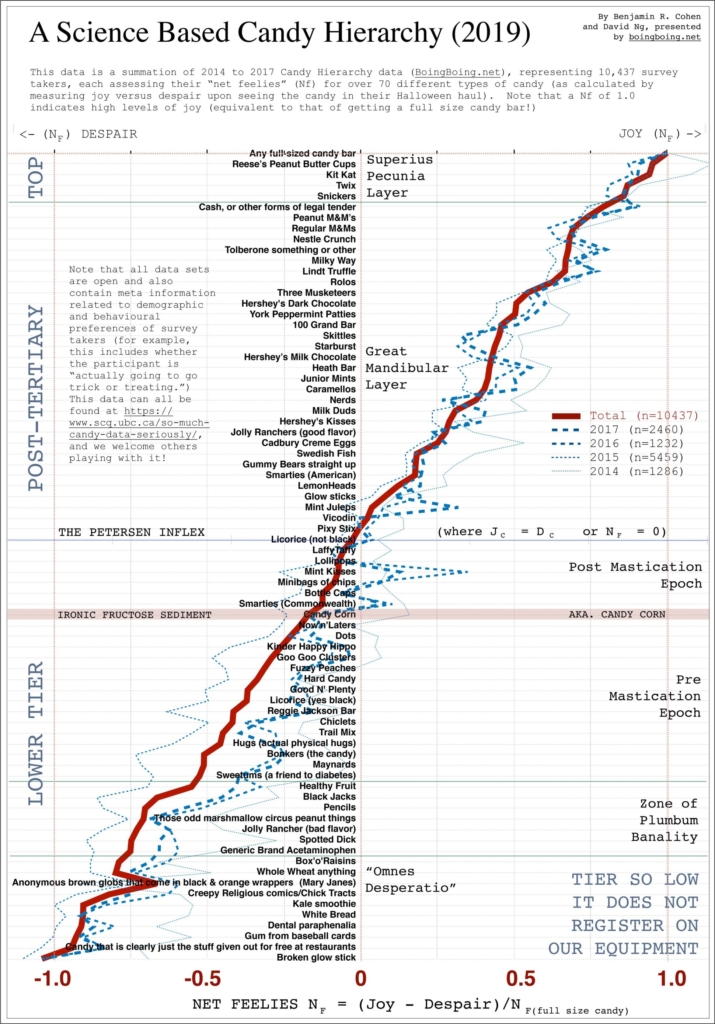
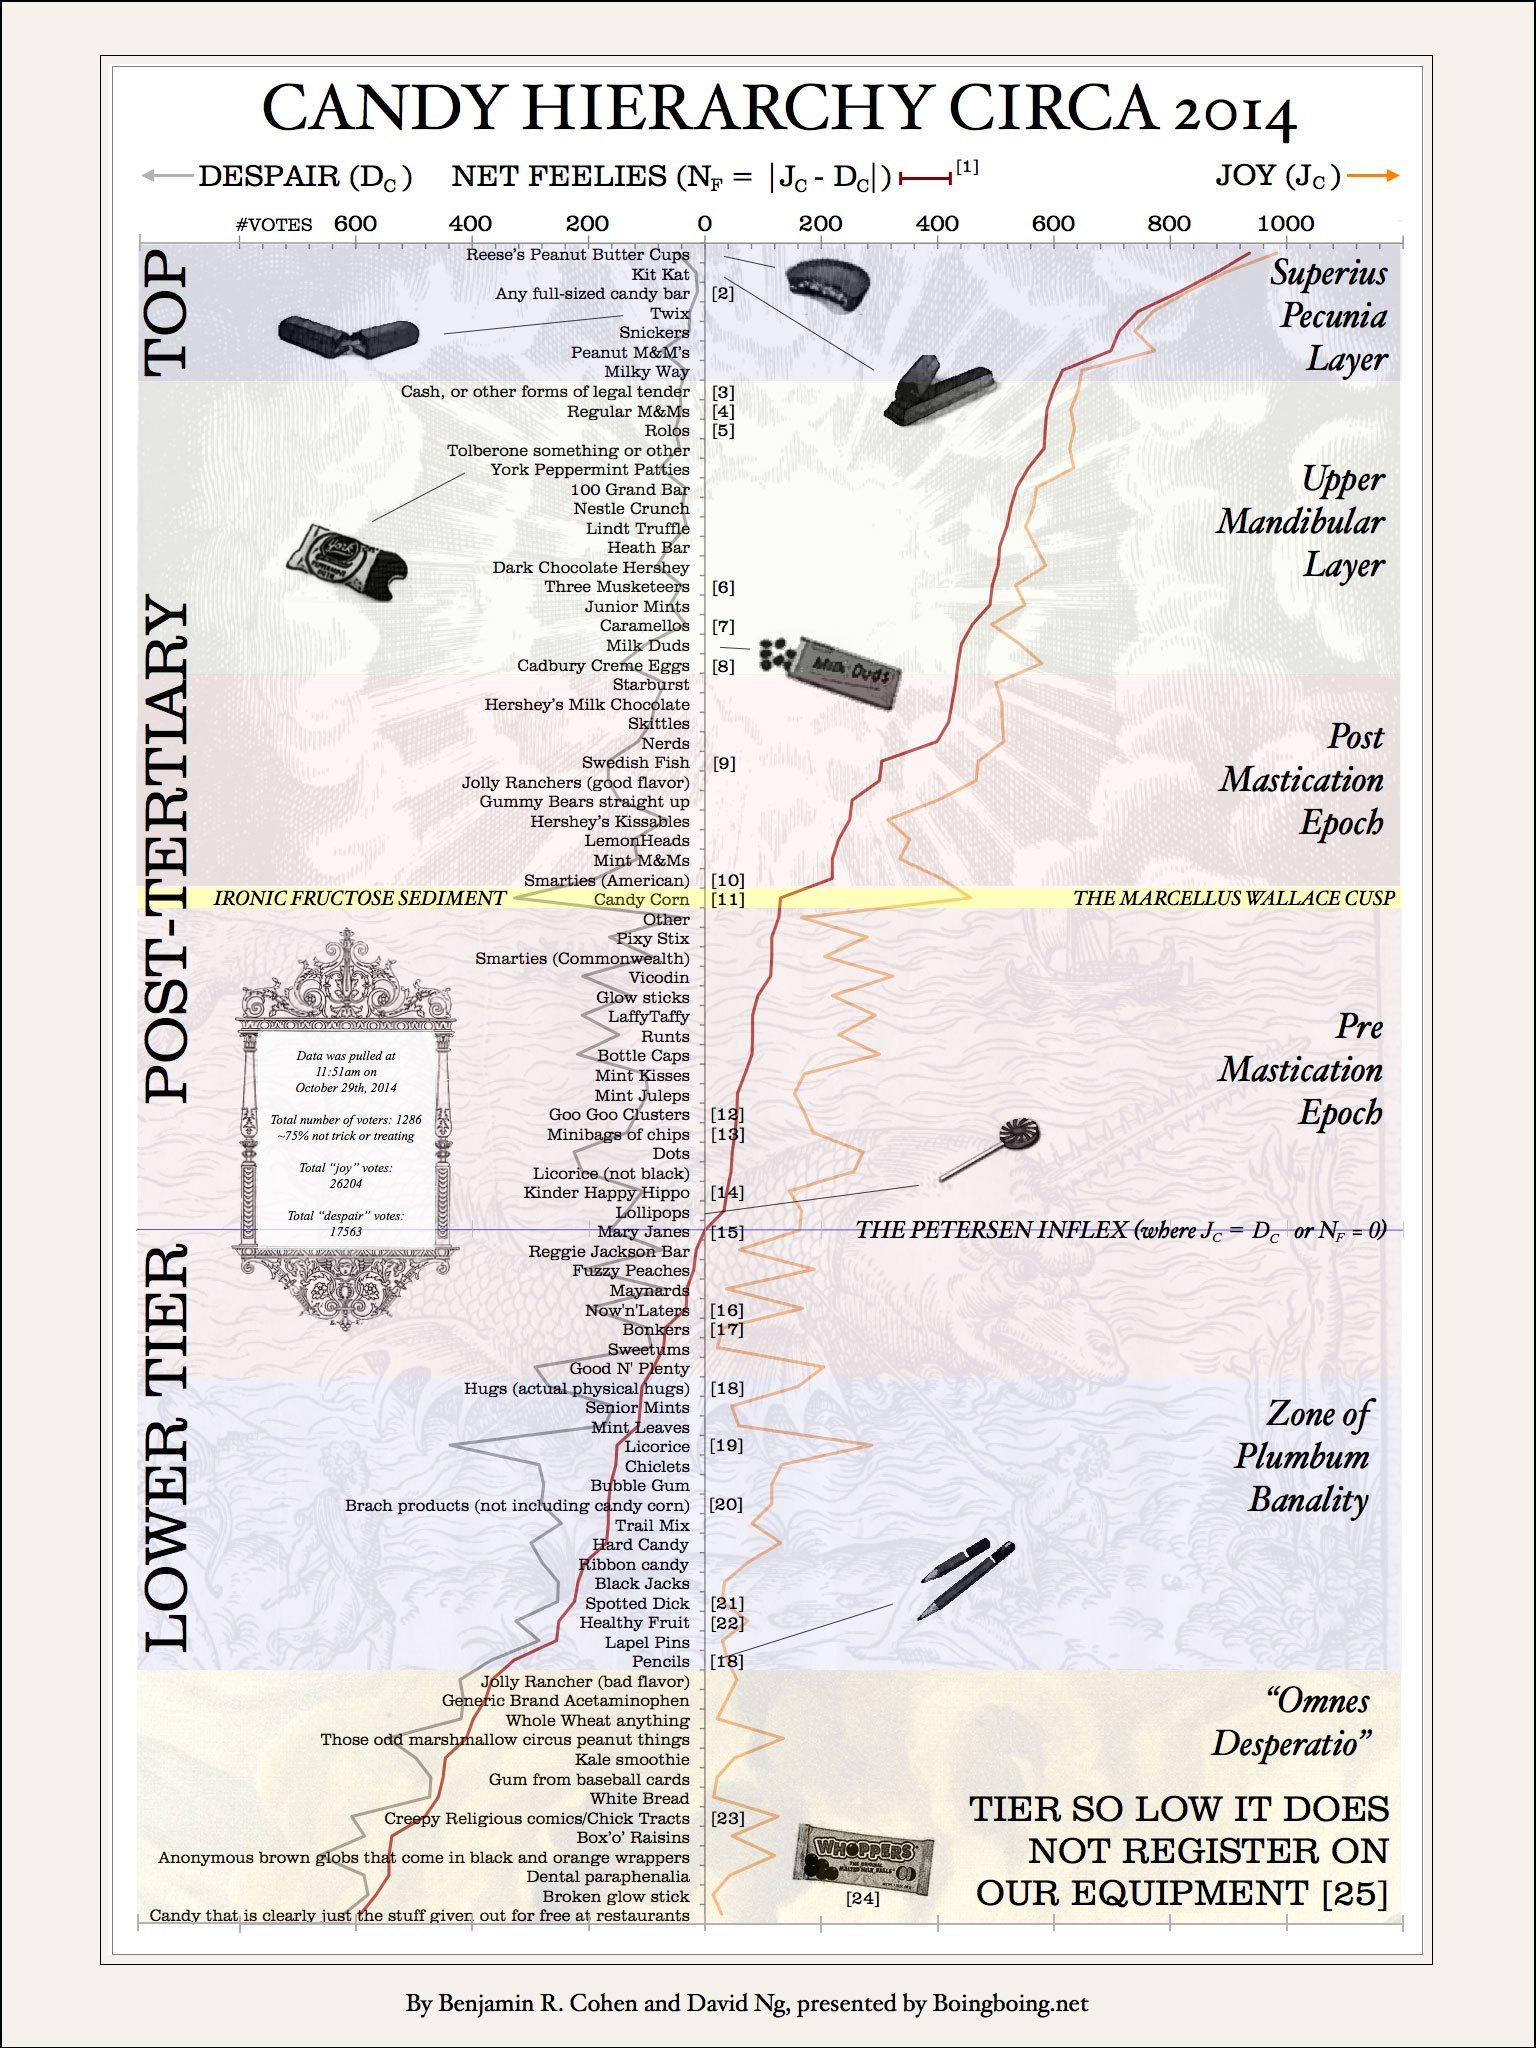
These are the facts. So factual that we contrived a mathy-sounding thing, Joy Induction and Despair, the difference of which is Net Feelies. Nf = |Jc – Dc|. Data sets abounded. In 2017, cognitive scientist and data analyst Shannon Ellis ran the numbers from our longitudinal study. The results confirm the coalescence to show only slight movement in the upper tier.
Maybe more important was the addition of non-candy data that gave greater context to our candy eating lives.** Specifically, obviously, we mean the Friday-Sunday question run by @somelaterdate’s Various Breads and Butters (the only undefeated podcast about small college life, now retired in triumph). Do you, as a person, as a human, prefer the day Friday or Sunday? Those are the only two choices. Pick one. A lot of people. Like, ~10,000 people. In what we now understand is The Platinum Ratio, respondents prefer Friday to Sunday at a strikingly consistent 2-to-1 ratio. More to the point, Friday people dislike black licorice while sad-sack Sunday people favor it. Go ask someone. Ask that dude reading over your shoulder on the subway right now. See?
But back to the good candy, know this: When CNN reports on a new Monmouth survey showing Reese’s, Snickers, and M&Ms at the top, your answer is “no shit, people.”
When FiveThirtyEight shows a power ranking with a top four including Reese’s, Twix, Kit Kat, Snickers, your answer is “no shit, people.”
When The Cut does a slow reveal to say that the top ranked candy is…wait for it…a little longer, keep waiting…Reese’s Peanut Butter Cups, pack it up, shut it down, walk away, we know.
And, and, when the La Times doesn’t even have Peanut Butter Cups in their top 20?? What the what?, then you know they are officially the Rasmussen Survey of Candies, pointless, erroneous, literally unbelievable.
To bind this all up, we encourage readers to download and carry with them this Official Candy Hierarchy for 2019 [PDF]. It collects, confirms, codifies, and captures the essence of candy priority. It is, at last, the answer we’ve been looking for all these years.
(Originally published at Boingboing.net – https://boingboing.net/2019/10/30/the-official-2019-candy-hierar.htmlhttps://boingboing.net/2019/10/30/the-official-2019-candy-hierar.html)
ARCHIVE OF PAST HIERARCHIES
For the sake of historical significance, here are links to previous Candy Hierarchies (at least the ones we could find), grouped by aesthetic criteria:
Mostly Ben ruminations, no graphics yet phase:
2006 post
2007 post
2008 post
Dave collaborates, has too much time to procrastinate and makes a graphic:
2010* post, graphic
2011 post, graphic
2012 post, graphic
*technically an appendum to 2008, with new graphic.
Ben and Dave up their game: graphic is probably overly complicated but whatever:
2013 post, graphic
Real data enters the fold: The era of proper Halloween candy science, and we think, a big deal:
2014 post, graphic
2015 post, graphic
2016 post, graphic
2017 post, graphic